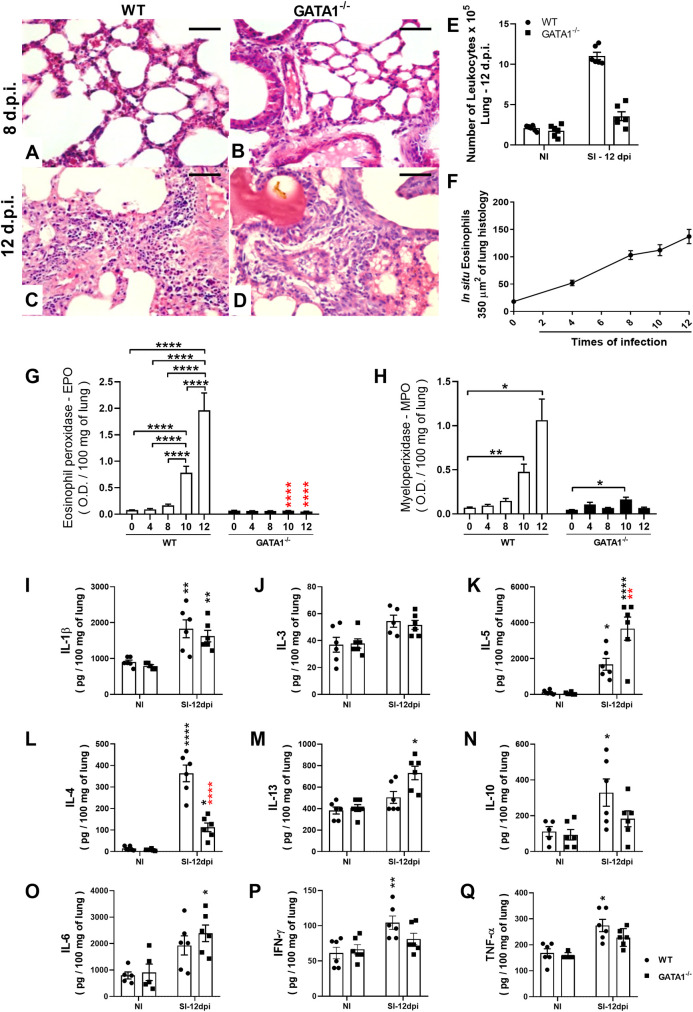
Fig 5. Eosinophils contribute to pulmonary inflammation during A. suum single-infection in mice.
Histopathological analysis of the lesion caused by larval ascariasis and lung inflammation in WT BALB/c and GATA1-/- mice on the 8th and 12th dpi (n = 6). Representative microphotography of lung tissue stained with H&E (Bar scale = 50 μm) (A-D). Number of total leukocytes recovered from BAL on the 8th dpi (n = 6) (E). Number of eosinophils in situ in the lung at 0, 4, 8 and 12 dpi (n = 5) (F). Optical density representing Eosinophil peroxidase (EPO) and neutrophil myeloperoxidase (MPO) activity in the lung at 0, 4, 8, and 12 dpi (n = 12) (G and H). Levels of cytokines in the lung at the 12th dpi (n = 6) (I—Q). Data are represented as mean ± SEM. One-way ANOVA followed by Tukey´s multiple comparisons test was used to evaluate differences between groups (G, I, J, K, L, N, O, and P). Kruskal-Wallis test followed by Dunn´s multiple comparisons test was used to evaluate differences between groups (H, M, and Q). The p values are represented by symbols in the graphs wherein * represents differences between the non-infected group, * represents differences between same groups in the 8 dpi, # represents differences between groups from different strains that received the same treatment. [1 symbol = p < 0.05], [2 symbols = p < 0.01], [3 symbols = p < 0.001] and [4 symbols = p < .0001].

