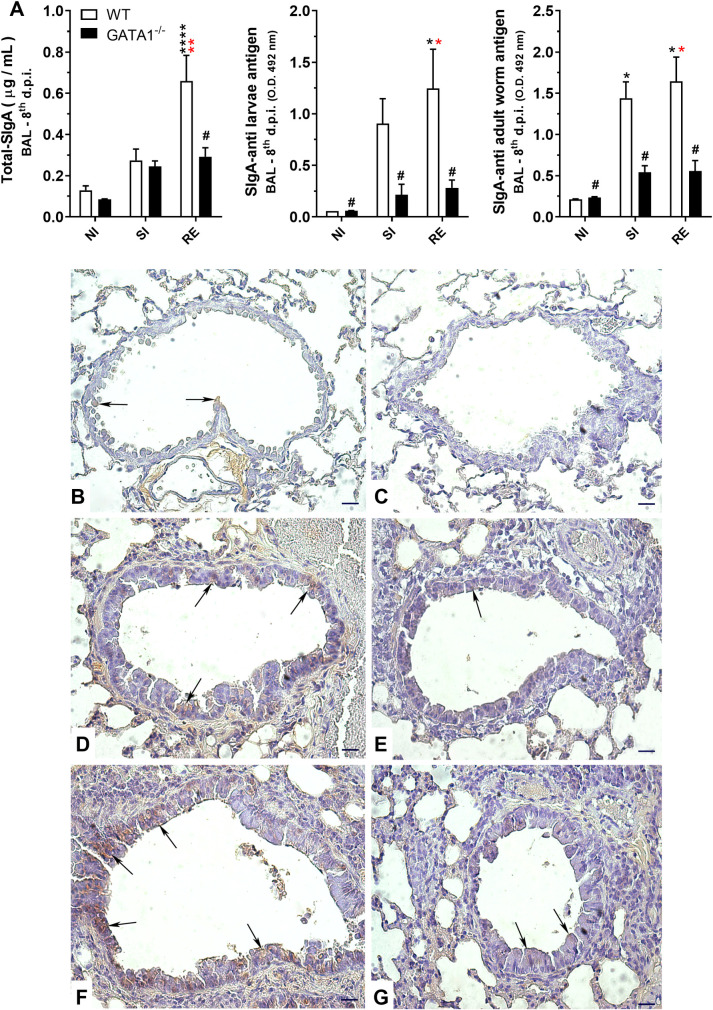
Fig 8. Effect of eosinophil deficiency in IgA production in lungs after larval ascariasis.
Total SIgA and Ascaris-specifics SIgA levels in bronchoalveolar lavage (BAL) (n = 5) (A). Representative microphotography of IgA immunohistochemistry in lung tissues (B-G) showing immunostained cells predominantly in the peribronchial spaces and the bronchial epithelium. Non-infected WT BALB/c (B), non-infected GATA1-/- (C), single-infected WT BALB/c (D), single infected GATA1-/- (E), re-infected WT BALB/c (F), and re-infected GATA1-/- (G) (n = 6). IgA is marked in brown. Arrows indicate positive markings on the bronchial epithelium. Bar scale = 40 μm).

