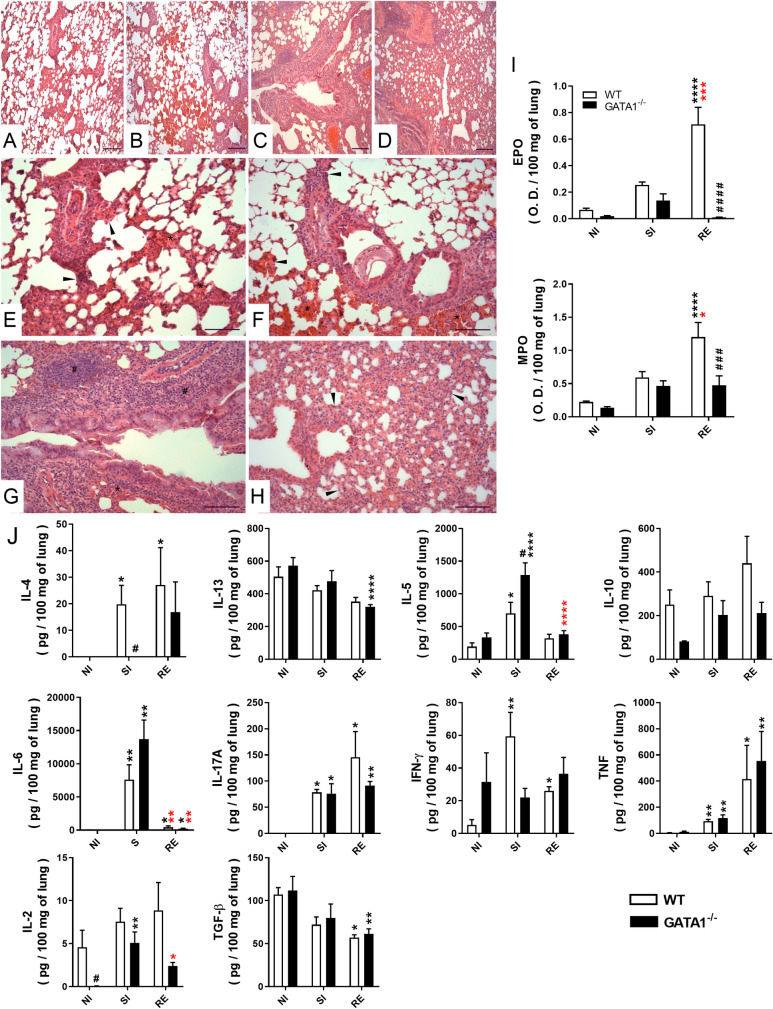
Fig 9. Effect of eosinophil deficiency on chronic pulmonary inflammation induced by multiple A. suum infections.
Representative microphotography of lungs tissues stained with H&E and observed on the 8th dpi at low magnification (Bar scale = 100 μm) (A-D) and at high magnification (Bar scale = 50 μm) (E-H), showing histopathological lesions in the single-infected group of WT BALB/c (A and E) and GATA-/- (B and F) (n = 6), and re-infected WT BALB/c (C and G) and GATA1-/- groups (D and H) (n = 6). Thickened septa are indicated with arrowheads, inflammatory infiltrates are indicated with ‘#’, hemorrhage is indicated with ‘*’. Optical density represents eosinophil peroxidase (EPO) and neutrophil myeloperoxidase (MPO) activity in the lung tissue at the 8th dpi (n = 10) (I). Tissue cytokine profile in the 8th dpi (n = 10) (J). Differences between groups were statistically evaluated using one-way ANOVA followed by Tukey´s multiple comparisons test for the data represented in (I) and the Kruskal-Wallis followed by Dunn’s multiple comparisons test in the data represented in (J). Data are represented as mean ± SEM. P values are represented by symbols in the graphs wherein * represents differences between non-infected groups, * represents differences between single-infected groups, # represents differences between groups from different strains that received the same treatment. [1 symbol = p < 0.05], [2 symbols = 0.01 > p > 0.05], [3 symbols = 0.001 > p > 0.01] and [4 symbols = p < 0.0001].

