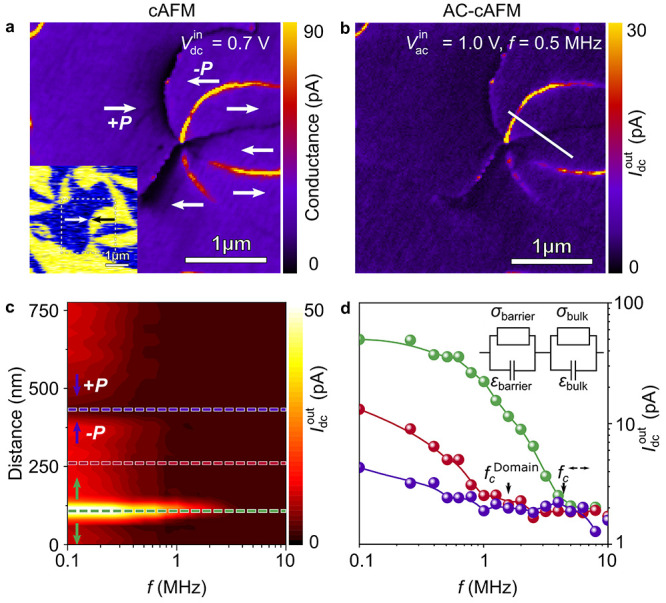
Figure 1.

ac response of charged ferroelectric domain walls in ErMnO3. (a) cAFM image displaying reduced and enhanced dc conductance at head-to-head and tail-to-tail domain walls, respectively. The polarization direction (indicated by the arrows) is obtained from calibrated PFM data, provided in the inset (blue, +P; yellow, −P). (b) AC-cAFM scan taken at the same position as the cAFM image in panel a. (c) Frequency-dependent evolution of the AC-cAFM signal along the solid line in panel b. Pronounced AC-cAFM contrast is observed at f = 0.1 MHz, vanishing toward increasing frequencies. (d) Local frequency-dependent AC-cAFM response evaluated along the dashed lines in panel c for a domain, a head-to-head, and tail-to-tail domain wall, indicating different cutoff frequencies, fc, (displayed by arrows) above which the respective signals disappear (fc←→ > fc > fc→←). The equivalent circuit model in the inset allows for relating the frequency drop to the local intrinsic conductivity,13 that is, σbulk > σbulkDomain > σbulk (barrier conductivity, σbarrier; barrier permittivity, εbarrier; bulk conductivity, σbulk; and bulk permittivity, εbulk).
