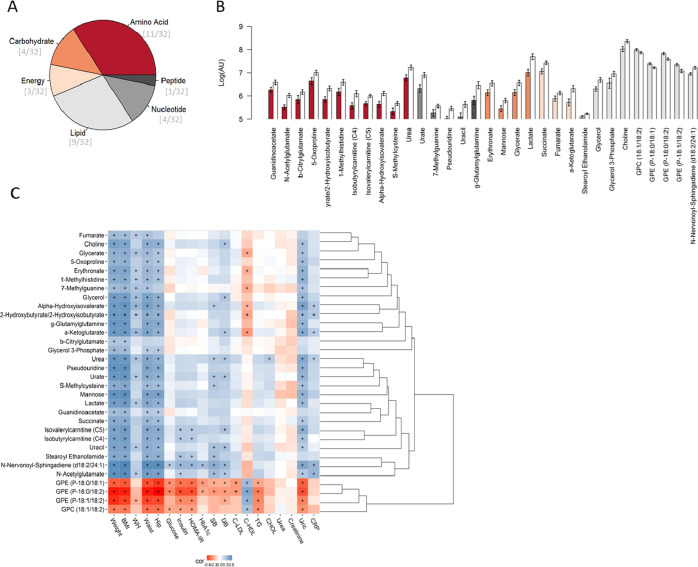
Figure 1.
Selected metabolites from the comparison between obese and nonobese subjects by random forest. (A) Summary of the chemical classes of the selected metabolites. (B) Mean and standard error of the logarithmic transformation of the levels of the discriminant metabolites in the obese subjects (white bars) and those of normal weight (colored and sorted according to the class of the metabolites). (C) Hierarchical clustered Spearman correlation matrix of the selected metabolites and anthropometric and clinical parameters by random forest analysis of obese and nonobese subjects. Adjusted p-values with the significant threshold set at <0.05 are marked with +. Positive correlations are in blue, and negative correlations are in red.

