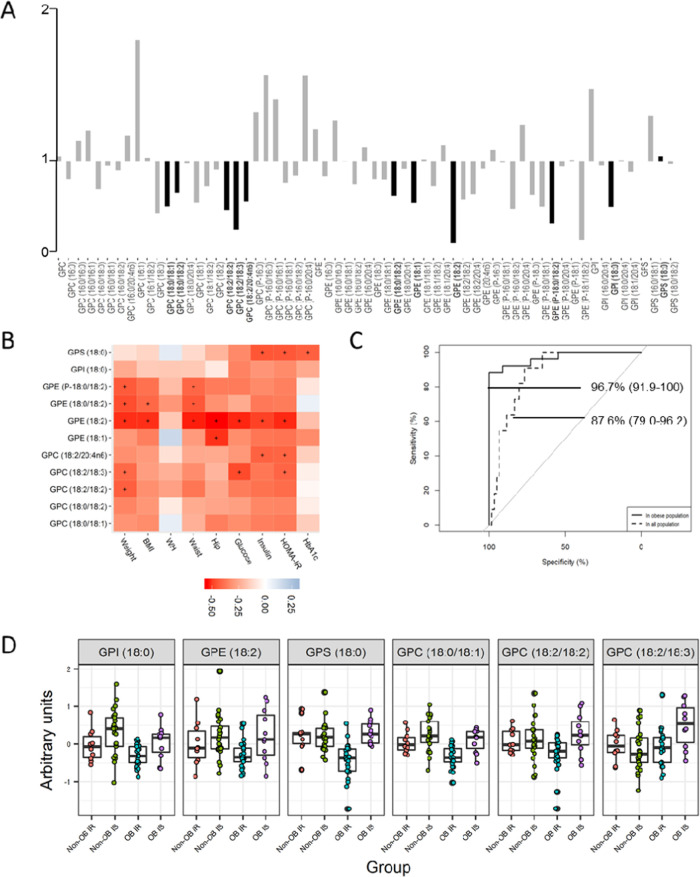
Figure 2.
VAT metabolome of the discordant phenotype of obesity. (A) Fold changes in the levels of lipid species between obese subjects with high insulin resistance and nonobese subjects with insulin sensitivity. Lipids significantly different between groups were marked in a dark color and with bold text (adjusted p-value < 0.25). (B) Spearman correlation matrix of the selected lipids with clinical variables. Adjusted p-values with a cutoff at <0.05 are marked with +. Positive correlations are in blue, and negative correlations are in red. (C) ROC curves (AUC%, CI 95%) of the multimetabolite biomarker model to identify the IS obesity metabotype among the obese population (IS and high IR) or all of the subjects of the study (normal weight and obesity and IS or high IR). The model was formed by GPE 18:2, GPI 18:0, GPS 18:0, GPC aa 36:1, GPC aa 36:4, and GPC aa 36:5, selected by the LASSO method. (D) Boxplot of the levels of the individual metabolites of the multimetabolite biomarker after logarithmic transformation and Pareto scaling. Abbreviations: AUC, area under the curve; CI, confidence interval; GPC, glycerophosphatidylcholine; GPE, glycerophosphatidylethanolamine; GPI, glycerophosphatidylinositol; PS, glycerophosphatidylserine.

