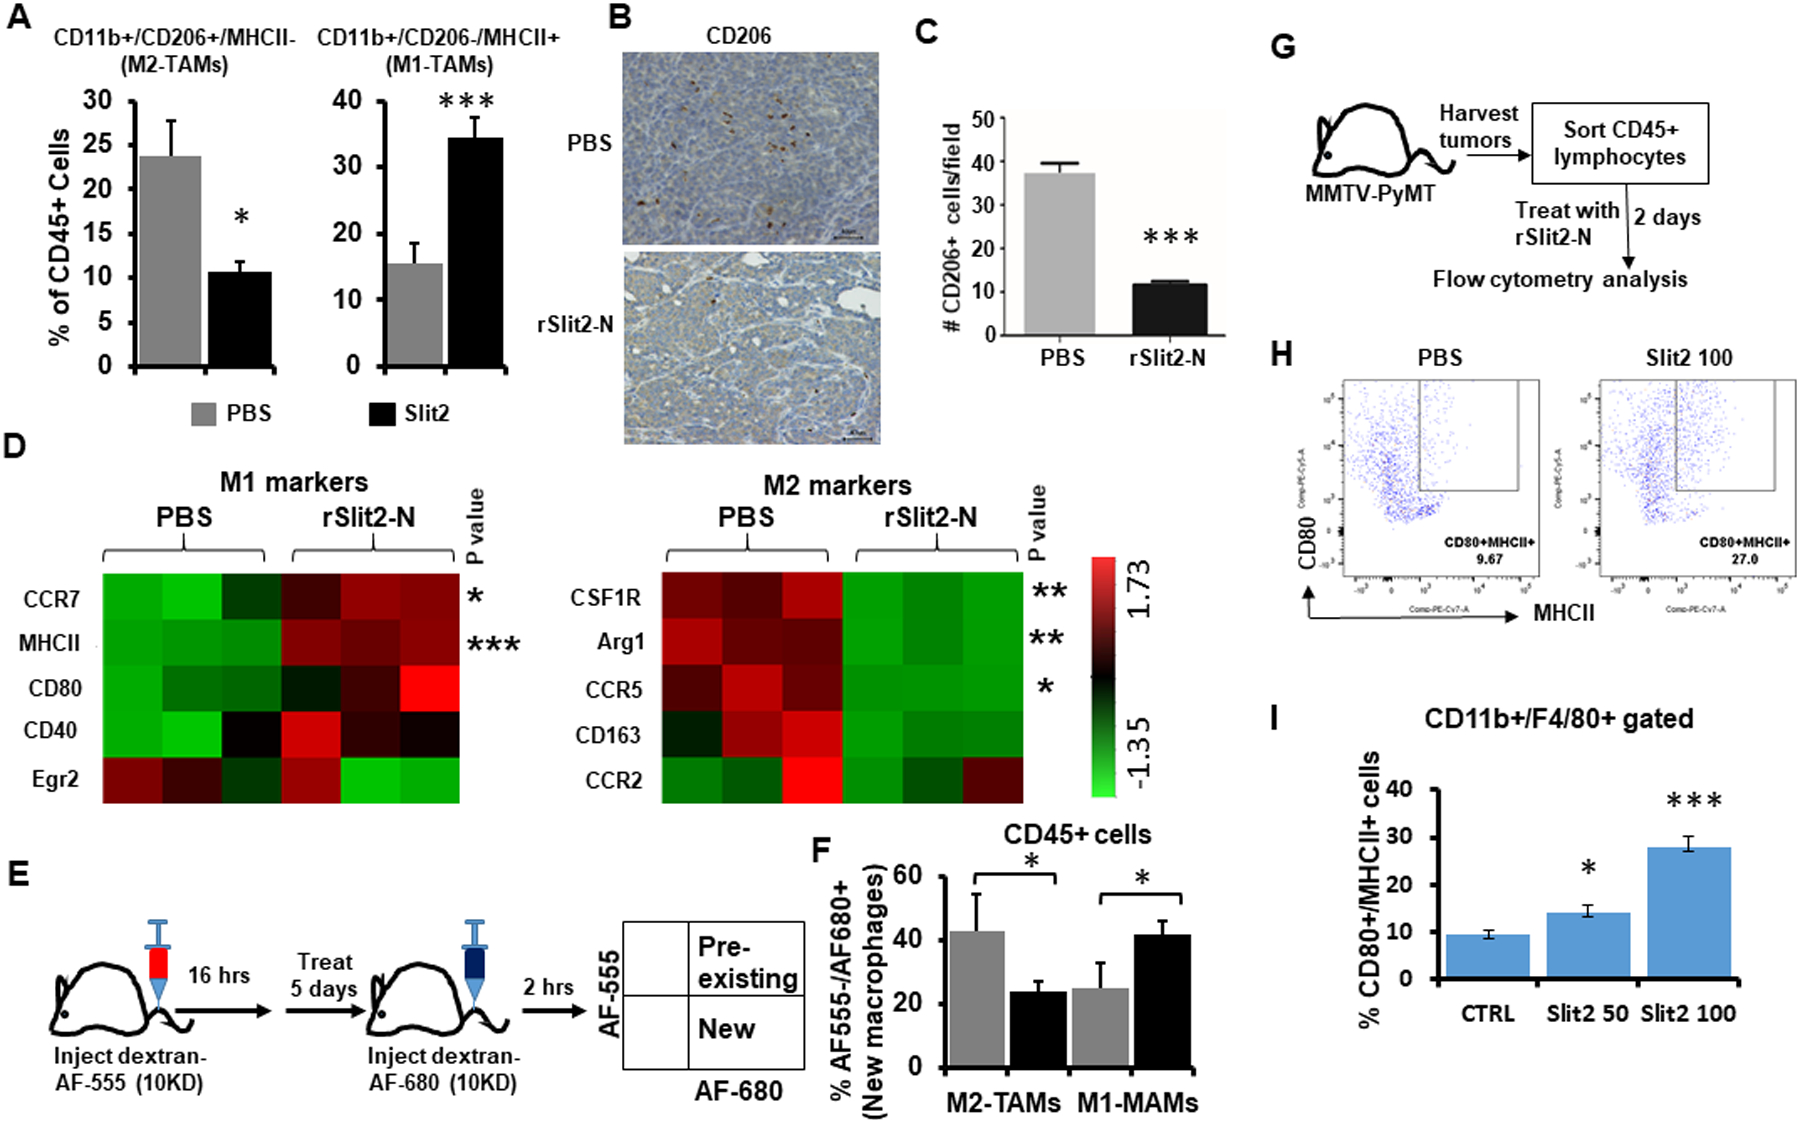
Figure 3: rSlit2-N treatment inhibits M2-TAMs polarization.

(A) The whole tumors harvested from MMTV-PyMT mice treated with rSlit2-N or PBS were processed into single cells and flow cytometry was performed. Graphs show the distribution of MHCII+ M1-TAMs and CD206+ M2-TAMs. N=5 mice per group.
(B) The representative pictures of rSlit2-N or PBS treated MMTV-PyMT tumors immunostained with CD206 antibody.
(C) The number of CD206+ cells per field was calculated.
(D) CD11b+ cells sorted from rSlit-N or PBS treated MMTV-PyMT tumors were analyzed for gene expression levels using Nanostring technology. The heat maps show expression levels of different M1 or M2 macrophage markers.
(E) To identify new and pre-existing macrophages, mice were pretreated with Alexa555 labeled dextran. The next day, mice were treated with rSlit2-N or PBS every day for 5 days. Mice were injected with Alexa680 labeled dextran two hours before euthanasia. The whole tumors were processed into single cells and flow cytometry was performed.
(F) The graph depicts the percentage of M2-TAMs and M1-TAMs present in rSlit2-N or PBS treated tumors. N=5 mice per group.
G-I. The whole tumors harvested from MMTV-PyMT mice were processed into single cells. Next, CD45+ leukocytes were sorted using magnetic beads technology. These cells were treated with 50 ng/ml rSlit2-N (Slit2 50) or 100 ng/ml rSlit2-N (Slit2 100) or PBS for 2 days. The cells were analyzed for MHCII+/CD80+ M1 type macrophages by flow cytometry. (H) Flow cytometry plots showing identification of CD80 and MHCII double positive (CD80+/MHCII+) macrophages. (I) Quantification of CD80+/MHCII+ cells in CD11b+/F4/80+ gated cells from (H), n=3 each group. * is p<0.05, ** is p<0.01, *** is p<0.001 using student’s t-test.
