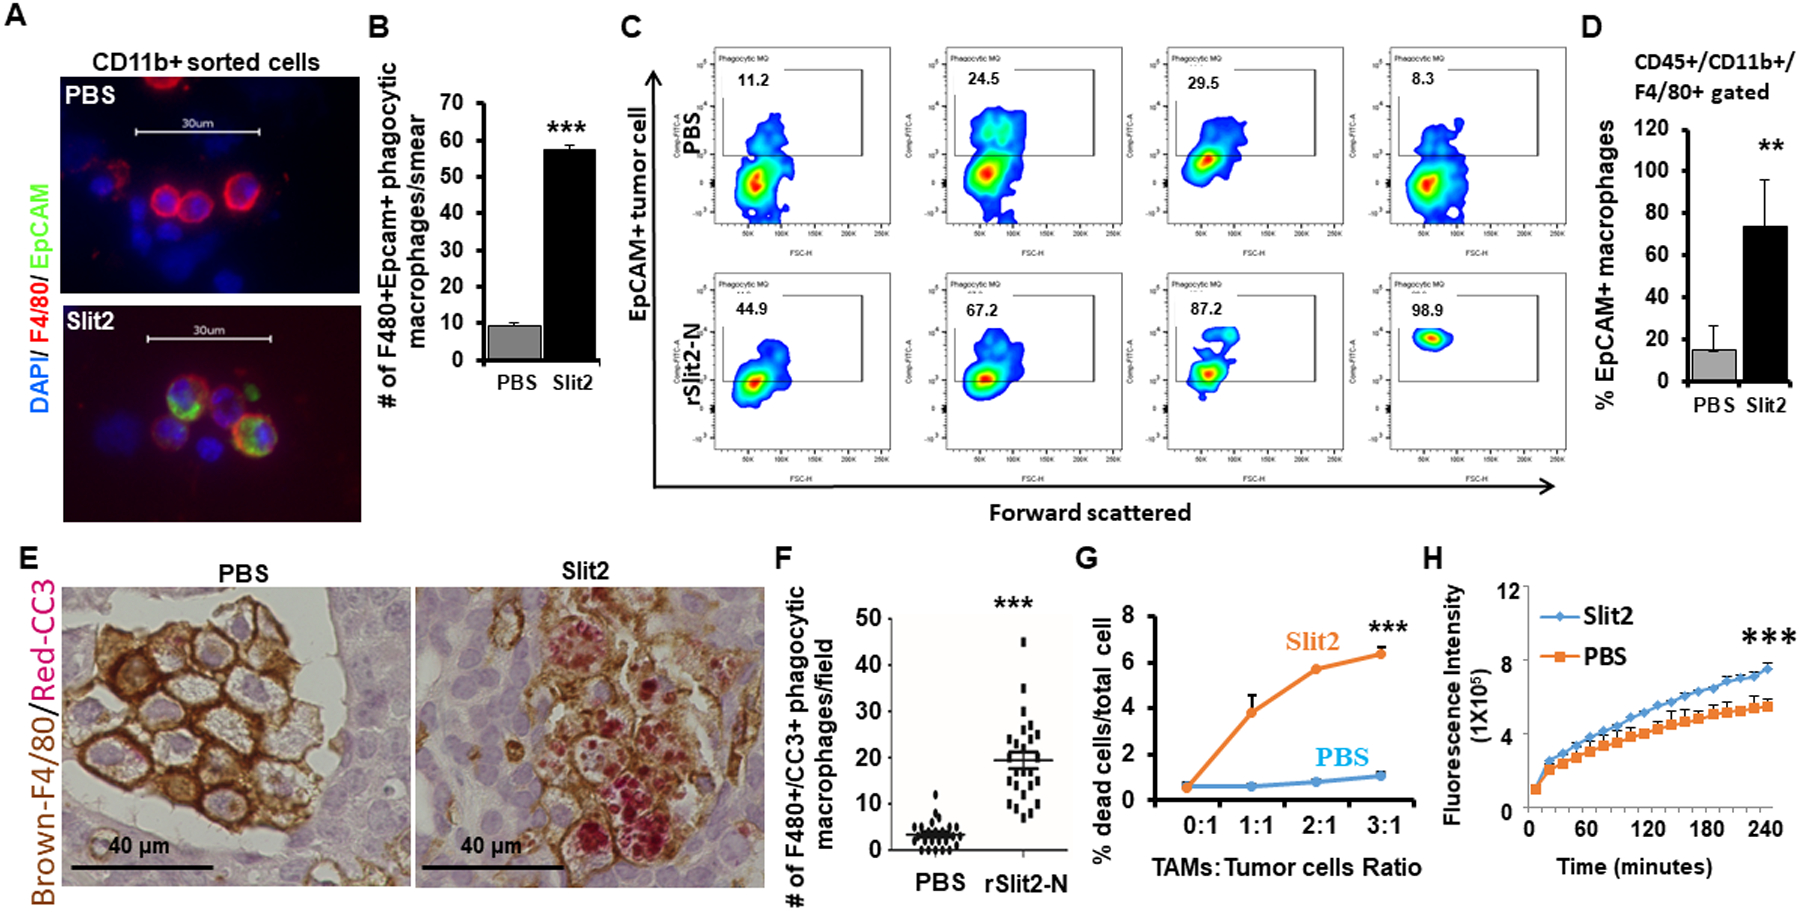
Figure 4: rSlit2-N enhances the phagocytic ability of TAMs.

(A) Whole tumors obtained from MMTV-PyMT mice treated with rSlit2-N or PBS were digested into single cells and CD11b+ cells were sorted. The cell aliquots were smeared onto a glass slide using cytospin, permeabilized, and stained with F4/80 and Epcam specific antibodies. The representative images showing phagocytic macrophages as F4/80+ cells that contain intracellular EpCAM, a marker of tumor cell.
(B) Quantification of phagocytic macrophages per smear as identified in (A).
(C) Single-cell preparations from rSlit2-N or PBS treated MMTV-PyMT tumors were also analyzed for phagocytic macrophages using intracellular flow cytometry. The cytometry plots are showing intracellular EpCAM signal inside CD45+/CD11b+/F4/80+ macrophages.
(D) The graph shows the percentage of EpCAM+ macrophages out of total macrophages in PBS or rSlit2-N treated tumors as identified in (C).
(E) Representative image of PBS or rSlit2-N treated MMTV-PyMT tumor sections immunostained with F4/80 and cleaved caspase 3 (CC3) antibodies and detected using peroxidase-DAB and alkaline phosphatase-Red substrate respectively to identify CC3-positive apoptotic bodies within macrophages.
(F) Quantification of F4/80+/CC3+ double-positive phagocytic macrophages per field as identified by IHC in (E). N= 5 mice in each group. Randomly selected 5 different areas from each tumor were analyzed.
(G) F4/80+ TAMs were sorted from tumors harvested from MMTV-PyMT mice. The TAMs were treated with rSlit2 or PBS overnight, followed by co-culture with tumor cells for 24 hours. Tumor cell death in vitro was analyzed by 7-aminoactinomycin D (7-AAD) labeling and flow cytometry. The graph shows a representative assay from two independent experiments, each performed in triplicate.
(H) The rSlit2-N or PBS pre-treated BMDMs were incubated with pHRhodo tagged S. Aureus bacteria at 37° C in a fluorescence plate reader and kinetics of bacterial phagocytosis was analyzed up to 4 hours. The graph represents fluorescence intensity generated by phagocytosis of bacterial particles. ** is p<0.01, *** is p<0.001 using student’s t-test.
