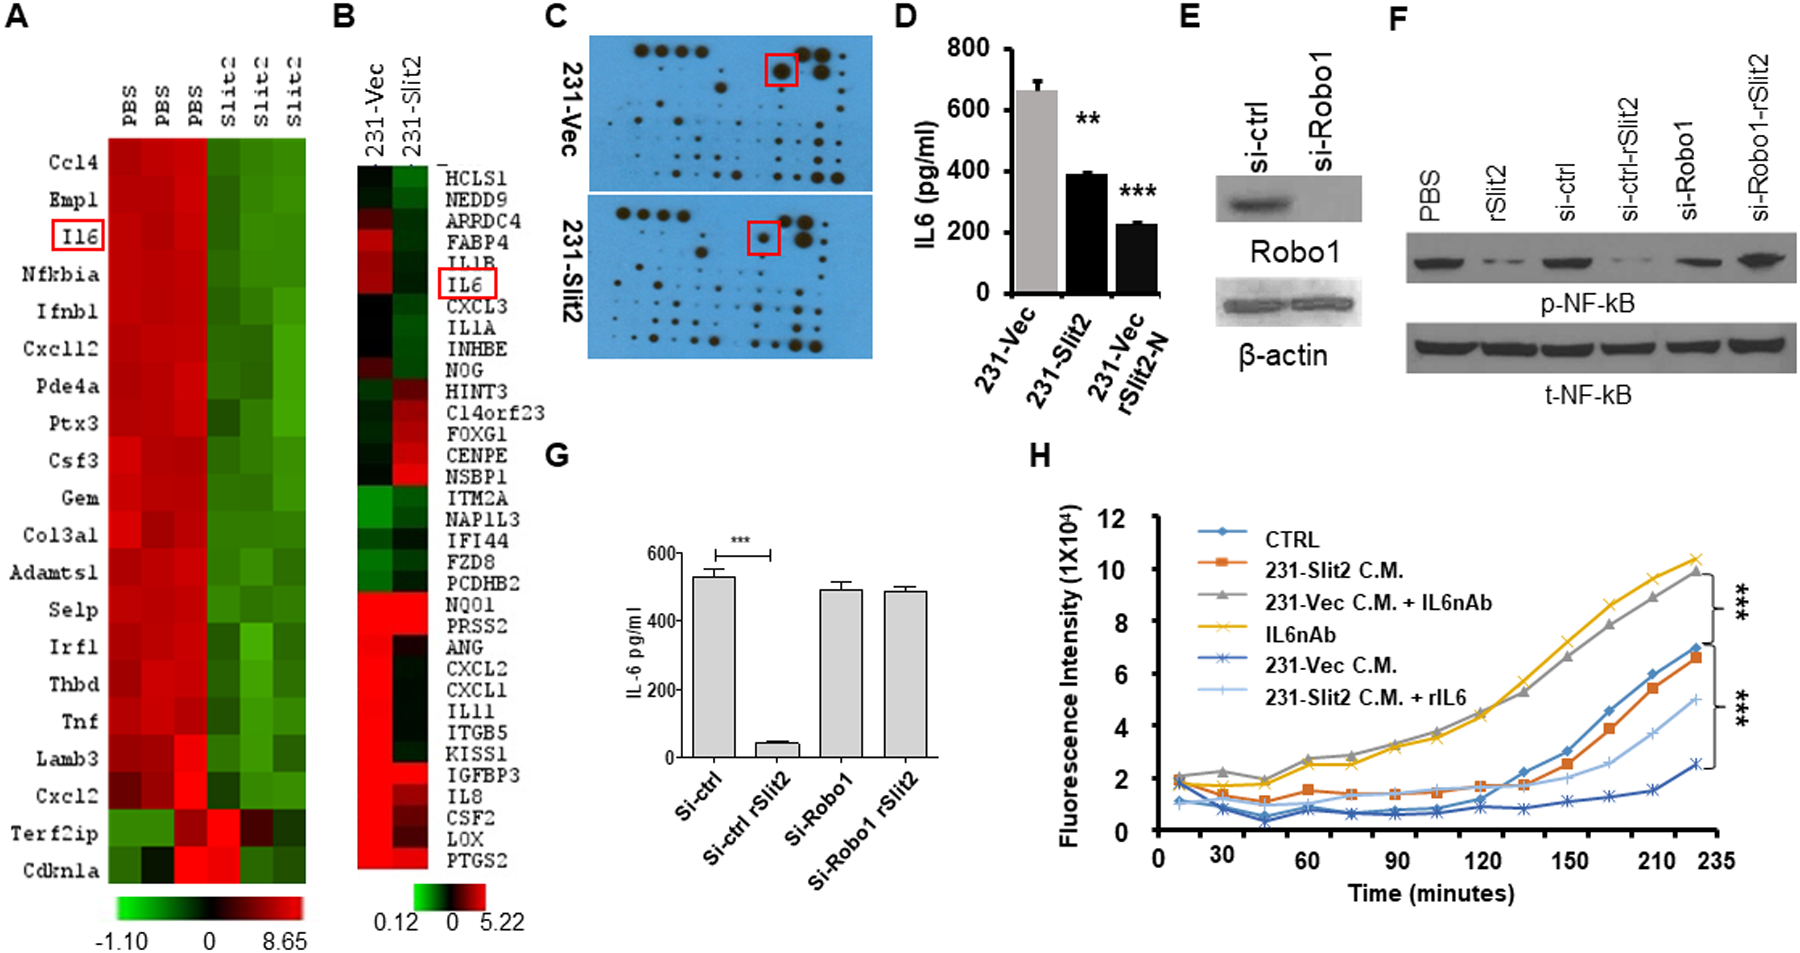
Figure 5. Slit2 reduces the expression of interleukin-6, thereby inhibiting TAMs activity.

(A) Total RNA of CD11b+ cells sorted from rSlit2-N PBS treated MMTV-PyMT tumors was subjected to gene expression analysis using Nanostring technology. The heat map shows differentially expressed top genes.
(B) Total RNA was isolated from MDA-MB-231 cells overexpressing Slit2 (231-Slit2) or vector control (231-vec) and analyzed for gene expression using microarray technology. The heat map shows differentially expressed top genes.
(C) 231-Slit2 or 231-Vec cells conditioned media (CM) was subjected to cytokine array analysis. The representative image shows differentially expressed molecules.
(D) The graph shows levels of IL6 in CM derived from 231-Sli2 or Vec CM detected by ELISA.
(E) Expression of Robo1 in MDA-MB-231 cells transduced with lentivirus expressing siRNA specific to Robo1 (si-Robo1) or control (si-ctrl) by western blot.
(F) β-actin was used as loading control. MDA-MB-231 parental control, si-Robo1 or si-ctrl from (E) were treated with rSlit2-N or PBS and phosphorylation at p65 of NF-κB (p-NF-κB) or total NF-κB (t-NF-κB) was analyzed.
(G) Graph showing levels of IL6 in si-Robo1 or si-ctrl MDA-MB-231 cells treated with rSlit2-N or PBS detected by ELISA (n=3 each group).
(H) BMDMs were pre-treated with serum-free Conditioned Media (CM) (CTRL), or 231-Slit2 CM or 231-Vec CM or 231-Vec CM pre-incubated with IL6 nAb (231-Vec + IL6nAb) or IL6 nAb. After 2 hours, pH-Rhodo labeled S. Aureus particles were added to the cells and recombinant IL6 was added to the 231-Slit2 CM cells (231-Slit2-rIL6). The kinetics of S. Aureus phagocytosis was analyzed using a fluorescence plate reader at every 15 minutes up to 4 hours.
* is p<0.05; ** is p <0.01; *** is p <0.001 using Student’s t-test.
