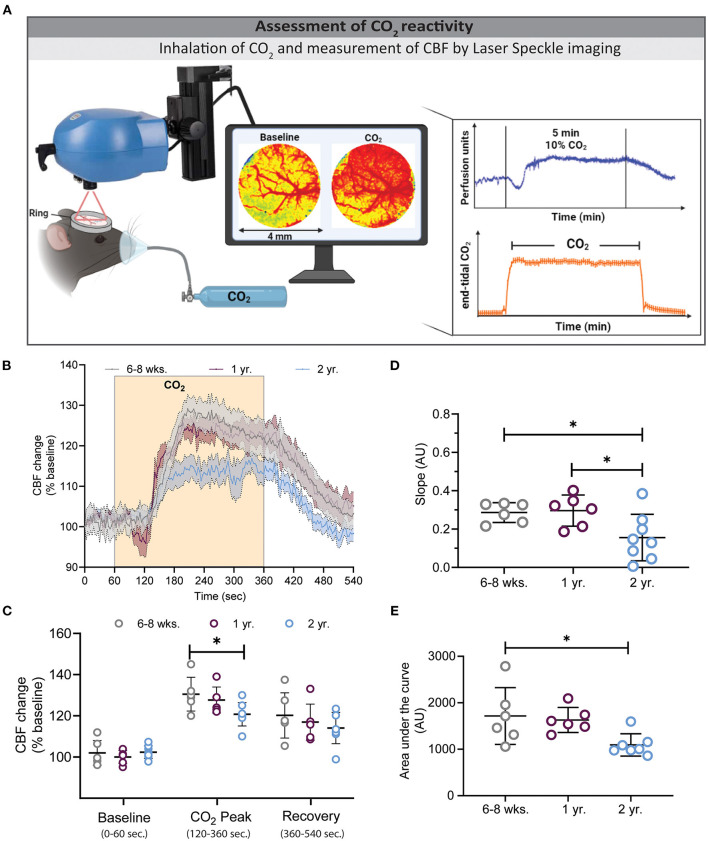
Figure 2.
Assessment of CO2 reactivity using laser speckle contrast imaging (LSCI). (A) Experimental setup of the CO2 challenge (left) and exemplary traces for LSCI perfusion (top right) and end-tidal CO2 (bottom right). (B) CBF changes before, during, and after hypercapnia in the three investigated age groups. Two-year-old mice showed a low (C) and slow (D) CBF increase during hypercapnia, whereas young and 1-year-old mice had higher peak values (*P < 0.05: 6–8 weeks vs. 2 year), and faster slope changes (*P < 0.05: 6–8 weeks vs. 2 year and 1 year vs. 2 year). (E) Quantification of the area under the curve (AUC) of graph B depicts smaller AUC in 2 year old mice in comparison to 6–8 weeks and 1 year old mice (*P < 0.05) (mean ± SEM, n = 6–8 mice/group, One-way ANOVA).

