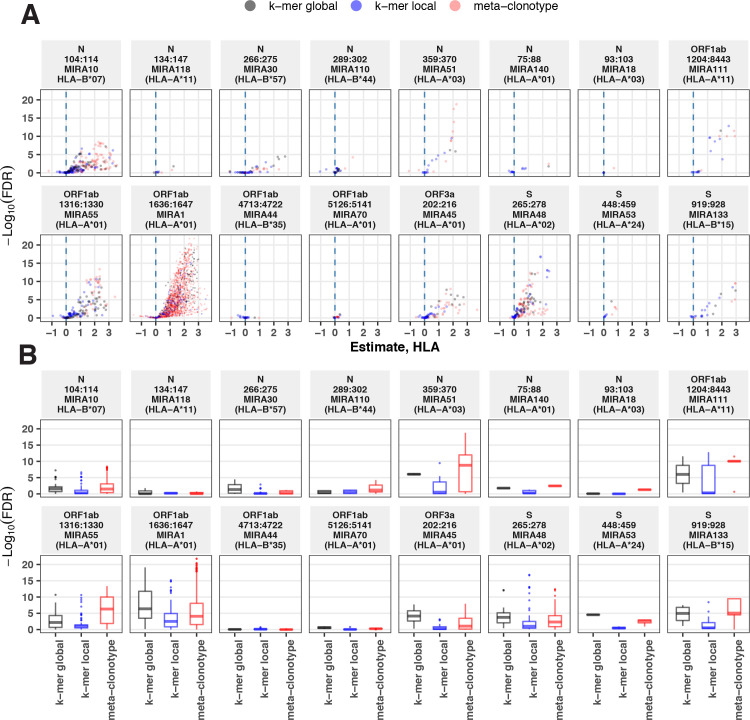
Figure 12. Associations between HLA genotypes in COVID-19 patients and abundance of epitope-specific complementarity determining region (CDR)3 k-mers or meta-clonotypes.
(A) Beta-binomial regression coefficient estimates (x-axis) for participant genotype matching a hypothesized restricting HLA allele and negative log10 false discovery rates (FDRs; y-axis) for features developed from CD8+ T-cell receptors (TCRs) activated by one of 17 HLA-restricted SARS-CoV-2 epitopes found in ORF1ab, ORF3a, nucleocapsid (N), and surface glycoprotein (S). MIRA183 yielded no significant meta-clonotypes (results not shown). Regression models included age, sex, and days postdiagnosis as covariates (not shown). Positive HLA coefficient estimates correspond with greater abundance of the TCR feature in those patients expressing the restricting allele. (B) Distribution of FDRs by feature identification method (k-mer local, k-mer global, or meta-clonotype [RADIUS + MOTIF]). Larger negative log10-tranformed FDR values (y-axis) indicate more statistically significant associations. Local k-mer (e.g., FRTD) and global k-mer (e.g., SFRTD.YE) were identified using GLIPH2 (Huang et al., 2020) and were used to quantify counts of conforming TCRs in each bulk-sequenced COVID-19 repertoire (see Method for details).

