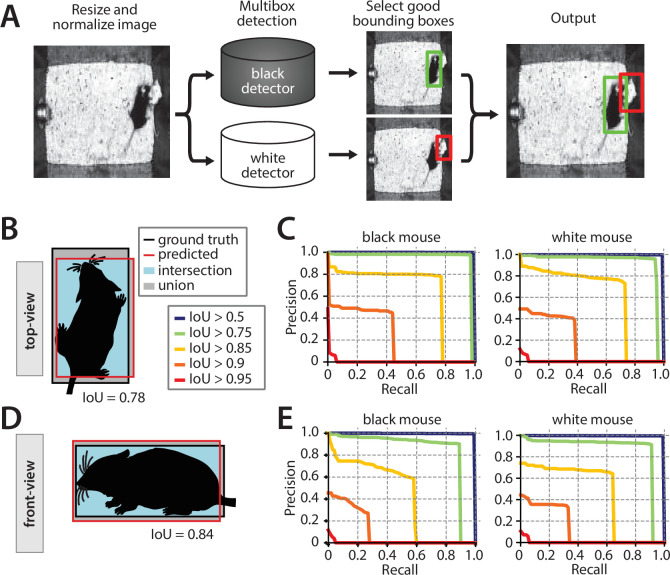
Figure 3. Performance of the mouse detection network.
(A) Processing stages of mouse detection pipeline. (B) Illustration of intersection over union (IoU) metric for the top-view video. (C) Precision-recall (PR) curves for multiple IoU thresholds for detection of the two mice in the top-view video. (D) Illustration of IoU for the front-view video. (E) PR curves for multiple IoU thresholds in the front-view video.

