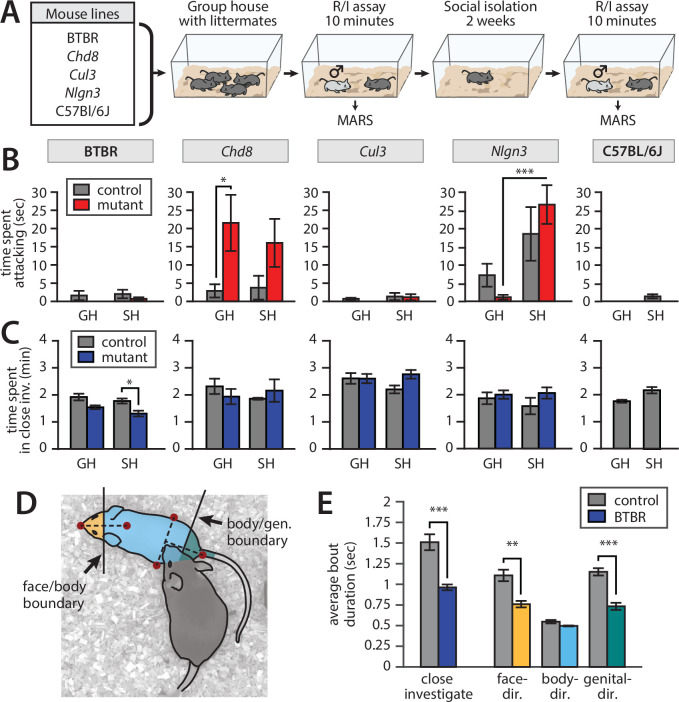
Figure 8. Application of Mouse Action Recognition System (MARS) in a large-scale behavioral assay.
All plots: mean ± SEM, N = 8–10 mice per genotype per line (83 mice total); *p<0.05, **p<0.01, ***p<0.001. (A) Assay design. (B) Time spent attacking by group-housed (GH) and single-housed (SH) mice from each line compared to controls (Chd8 GH het vs. ctrl: p=0.0367, Cohen’s d = 1.155, two-sample t-test, N = 8 het vs. 8 ctrl; Nlgn3 het GH vs. SH: p=0.000449, Cohen’s d = 1.958, two-sample t-test, N = 10 GH vs. 8 SH). (C) Time spent engaged in close investigation by each condition/line (BTBR SH BTBR vs. ctrl: p=0.0186, Cohen’s d = 1.157, two-sample t-test, N = 10 BTBR vs. 10 ctrl). (D) Cartoon showing segmentation of close investigation bouts into face-, body-, and genital-directed investigation. Frames are classified based on the position of the resident’s nose relative to a boundary midway between the intruder mouse’s nose and neck, and a boundary midway between the intruder mouse’s hips and tail base. (E) Average duration of close investigation bouts in BTBR mice for investigation as a whole and broken down by the body part investigated (close investigation, p=0.00023, Cohen’s d = 2.05; face-directed p=0.00120, Cohen’s d = 1.72; genital-directed p=0.0000903, Cohen’s d = 2.24; two-sample t-test, N = 10 het vs. 10 ctrl for all).

