Figure 1. Laminar multielectrode recordings from border ownership-selective units in area V4.
(A) Top row shows set of border ownership stimuli. Black dotted outline represents the classical receptive field (cRF). Bottom row shows that the stimulus information in the cRF is identical for stimuli 1 and 2, and for stimuli 3 and 4. (B) Dot rasters showing responses to the stimuli in A from a border ownership-selective well-isolated unit. The symbol on the left indicates the preferred side of border ownership for the unit. Average spike rates in the stimulus window are indicated above the panels. (C, D) Similar to A and B, for a multiunit cluster recorded during a different penetration. (E) Cartoon showing the recording setup. A laminar multielectrode probe with 32 channels was lowered through a transparent artificial dura (AD), orthogonal relative to the cortical surface. (F) Laminar compartments (superficial; granular [input]; deep layers) were estimated using current source density (CSD) analysis. See text for definitions of the compartments and explanation of symbols. Distance from center of granular layer is shown along ordinate on the left, and the number of electrode contact on the right (higher numbers correspond to more superficial contacts). Black solid triangle indicates position of most superficial electrode contact on which multiunit activity was recorded. Data are from the same penetration during which the unit in B was recorded. The position of the green symbol indicates that this unit was positioned in the deep layers. See also Figure 1—figure supplements 1–3. (G). Similar to F, for the penetration during which the unit shown in D was recorded. (H) Receptive field contours for multiunit activity recorded on different electrode contacts from the penetration shown in F. Contours are drawn at z = 3. Orthogonality of the penetration was evaluated by fitting a line through the centers of the receptive field contours and computing D, the distance between pairs of azimuth and elevation coordinates of receptive field centers per mm depth (Methods). (I) Similar to H, for the penetration shown in G.

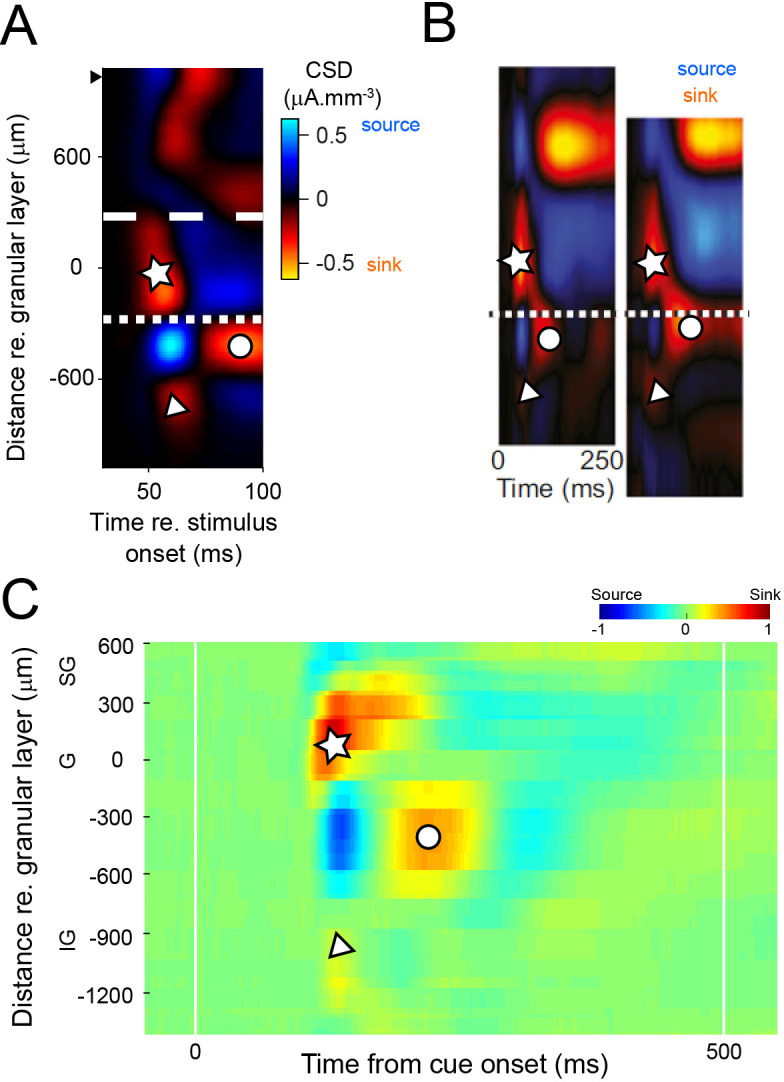
Figure 1—figure supplement 1. Construction of current source density (CSD) map.

Figure 1—figure supplement 2. Additional examples of current source density (CSD) maps.

Figure 1—figure supplement 3. Consistency of current source density (CSD) maps between studies and cortical areas.