. 2021 Nov 30;10:e72573. doi: 10.7554/eLife.72573

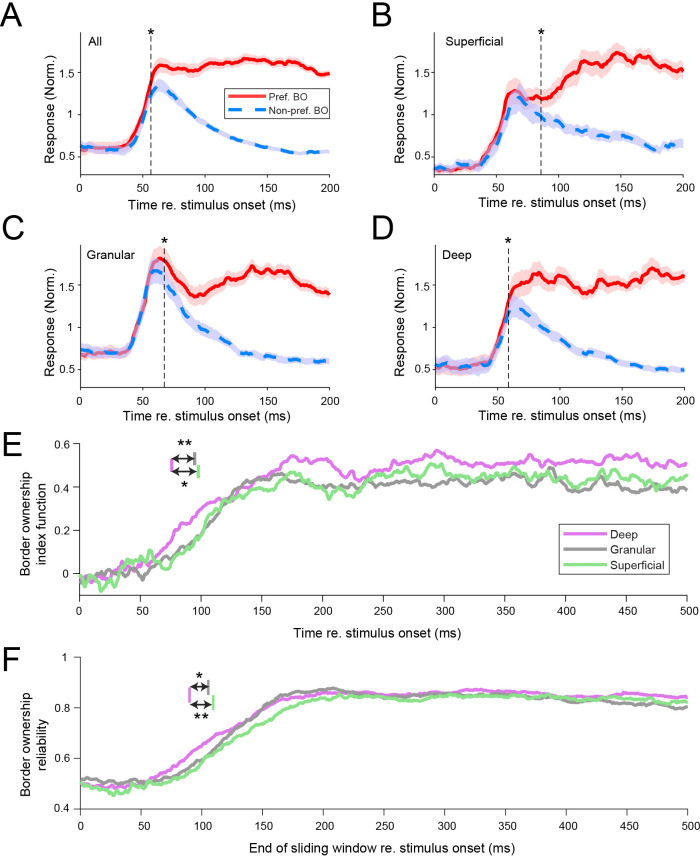
Figure 2. Border ownership selectivity occurs first in deep cortical layers.

(A) Response time courses for the population of border ownership-selective well-isolated units (n = 350). Functions are plotted separately for the responses to the preferred side of border ownership (solid red line; mean ± standard error of the mean [SEM]) and the non-preferred side of border ownership (dashed blue line). The vertical dashed line indicates when the difference between the functions first becomes significant (Wilcoxon signed rank test, p < 0.05 for ≥ 20 ms). (B–D) Similar to A, for the subpopulations of well-isolated units selective for border ownership that could be located, respectively, to superficial (B), granular (C), and deep (D) layers (see Methods for criteria of layer assignment). Superficial: n = 58 units; granular: n = 102 units; deep: n = 121 units. Analysis as in panel A. See also Figure 2—figure supplement 1. (E) Border ownership index functions of the different laminar compartments (see Methods). Colored vertical lines indicate latency for the different layers, defined as the earliest crossing of the border ownership index function for ≥20 ms with the threshold. The threshold was set at the level for which <1% of functions obtained after shuffling the stimulus labels had a defined latency (0.156). Latency, deep: 75.8 ms, 95% CI [68.4 85.2]; granular: 94.7 ms, 95% CI [82.2 105.7]; superficial: 97.7 ms, 95% CI [78.0 103.7]. **Bootstrap procedure (see Methods) p = 0.006; *p = 0.018. See also Figure 2—figure supplements 2 and 3. (F) Border ownership reliability calculated in a 100 ms sliding window for the three laminar compartments. Colors as in E. Colored lines in top of panel indicate the earliest crossing for ≥20 adjacent ms with the threshold, defined similarly as for panel E. Threshold crossings: deep 89.9 ms, 95% CI [81.5 99.9]; granular 105.4 ms, 95% CI [94.9 114.6]; superficial 109.4 ms, 95% CI [98.9 124.9]. **Bootstrap procedure p = 0.006; *p = 0.015.

Figure 2.

Figure 2—figure supplement 1. Differences in sample size do not explain differences in latency between layers.
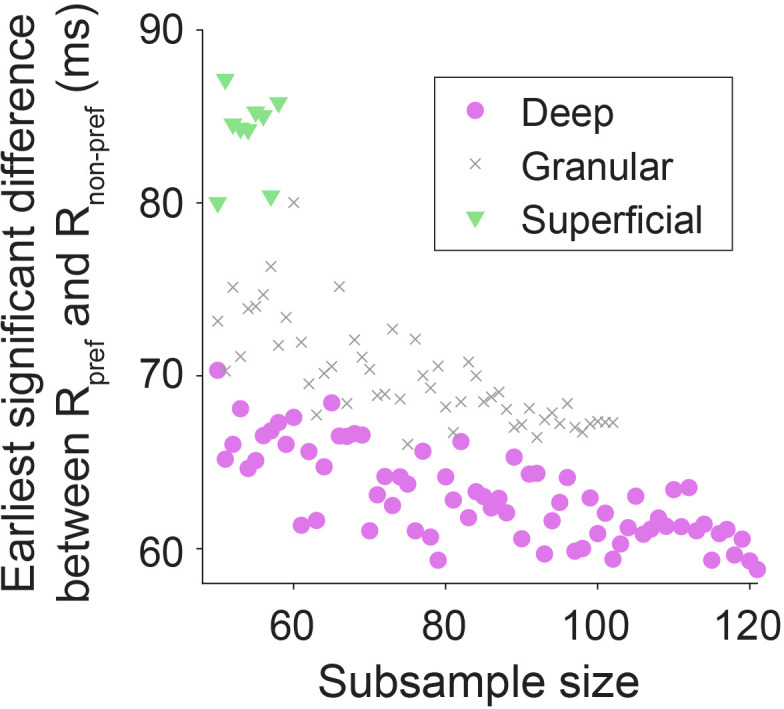
Figure 2—figure supplement 1.

The latency of significant difference between responses to preferred and non-preferred sides of border ownership was determined as in Figure 2B–D, for different subsample sizes (subsampling well-isolated units without replacement). Each subsample size was sampled five times and the average latency is plotted. The result shows that while the total number of units in each layer did differ, the shorter latency for deep layer units than for granular or superficial layer units consistently appeared at all subsample sizes (consistent with data shown in Figure 2B–D), and is not explained by differences in sample size between compartments.
Figure 2—figure supplement 2. Selectivity for contrast polarity does not occur earliest in the deep layers.

Figure 2—figure supplement 2.

Same analysis as Figure 2E, but for contrast polarity instead of border ownership, for the same units as in Figure 2E. Latency at same threshold as in Figure 2E: deep: 57.0 ms, 95% CI [49.9 75.0]; granular: 42.8 ms, 95% CI [35.4 60.8]; superficial: 50.2, 95% CI [40.4 56.4]. Granular versus deep: bootstrap procedure p = 0.14. Granular versus superficial: p = 0.12. That border ownership units are often selective for contrast polarity is consistent with a prior study (Zhou et al., 2000).
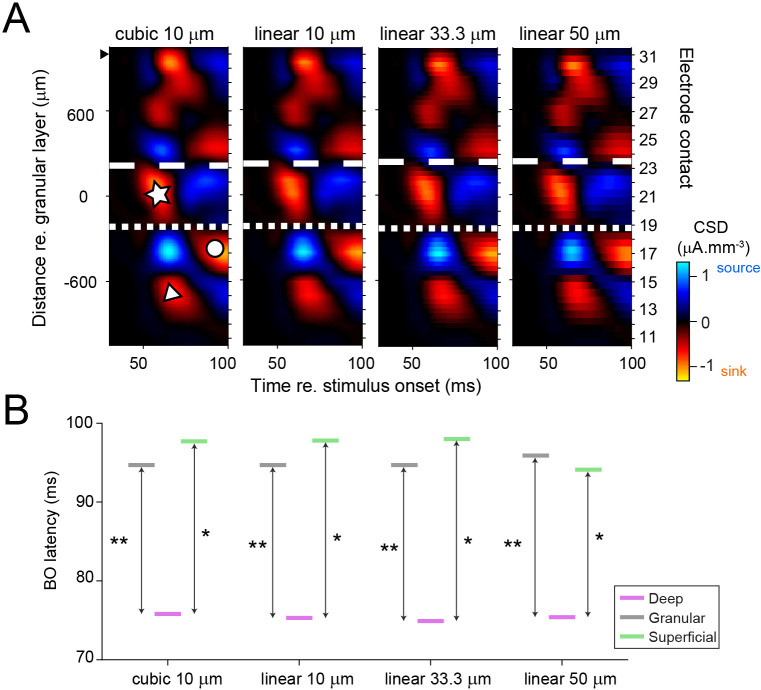
Figure 2—figure supplement 3. Laminar analysis is not affected by how the current source density (CSD) maps were smoothed.

Figure 2—figure supplement 3.

(A) Example CSD map smoothed with different methods. Leftmost panel corresponds to the cubic interpolation with 10 µm spatial resolution that was used in the main analysis. Other panels are computed with 2D linear interpolation (MATLAB function interp2 with option linear), with varying degrees of spatial resolution (respectively, 10, 33.3, and 50 µm). Boundaries between laminar compartments are drawn for each smoothing method separately for the population of penetrations (to ensure that we did not bias the results we blinded ourselves to the original layer assignment when applying each method). White dashed and dotted lines show boundary positions for the example penetration for each smoothing method. In the population, the assigned laminar compartment was the same as that when the standard interpolation method was used (cubic 10 µm) for 98.1 % (linear 10 µm), 97.7 % (linear 33.3 µm), and 97.1 % (linear 50 µm) of well-isolated units (n = 685). (B) After performing the laminar assignment separately for the different smoothing methods (see A), latencies were computed on border ownership (BO) index functions for the population of well-isolated units (as in Figure 2E). Irrespective of the method used, the BO latency of deep layer units was always significantly shorter than that of granular layer units and superficial layer units. *p < 0.05 (exact p values from left to right: 0.018, 0.018, 0.015, and 0.025); **p < 0.01 (exact p values from left to right: 0.006, 0.004, 0.005, and 0.0025).