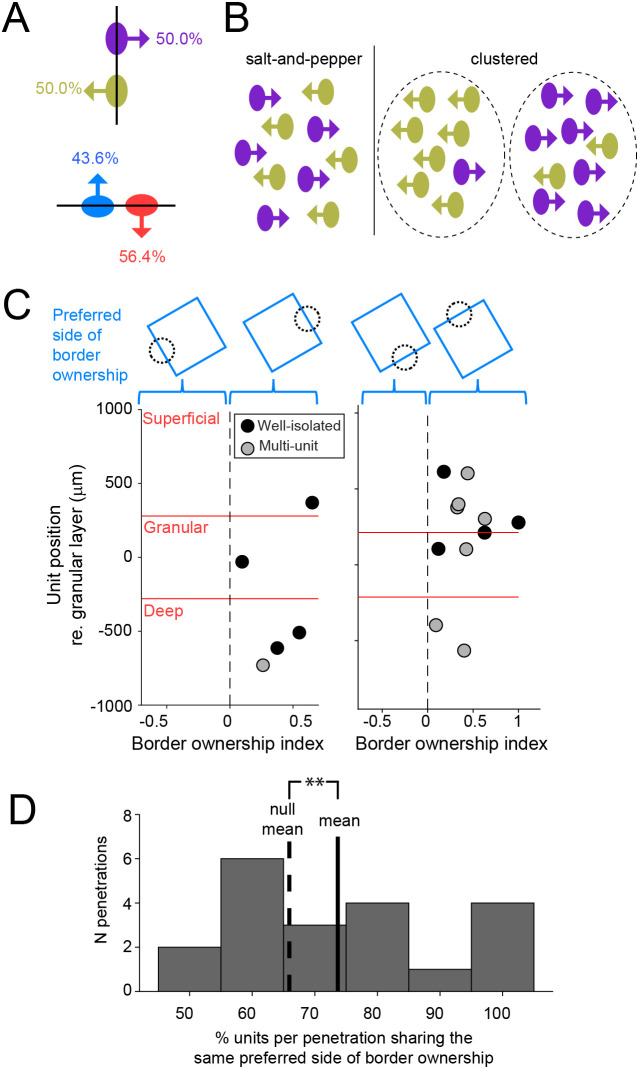
Figure 4. Preferred side of border ownership is clustered.
(A) For a given edge, there are two possibilities for preferred side of border ownership. Percentages indicate the fraction of well-isolated units selective for border ownership that have the preferred side of border ownership indicated by the arrow (vertical edge: n = 64; horizontal edge: n = 78). See also Figure 4—figure supplement 1. (B) Cartoon showing possibilities for spatial organization of neurons with opposite preferred sides of border ownership, for a vertical edge. (C) Each panel shows border ownership-selective units recorded during one penetration. The abscissa shows the signed BOI of each unit (sign indicates preferred side of border ownership, shown above the panels). Ordinate shows the position of the units relative to the center of the granular layer. (D) Histogram of the proportion of units per penetration that shares the same preferred side of border ownership, for all penetrations with at least four border ownership-selective well-isolated and multiunits spanning from superficial to deep cortical layers. Solid line is distribution mean, dashed line shows null distribution mean. **p = 0.003 (20 penetrations with 136 units).
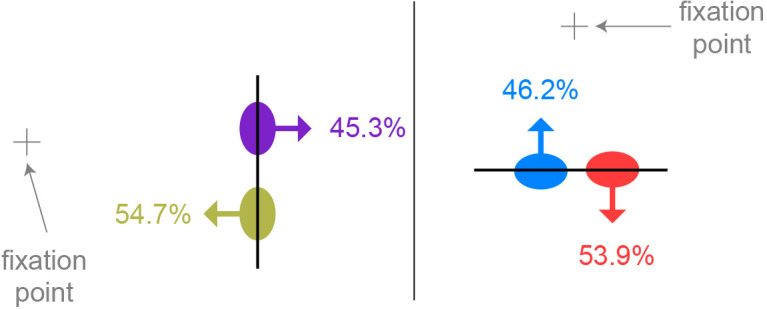
Figure 4—figure supplement 1. Similar to Figure 4A, but expressing preferred side of border ownership relative to the position of the fixation point.


