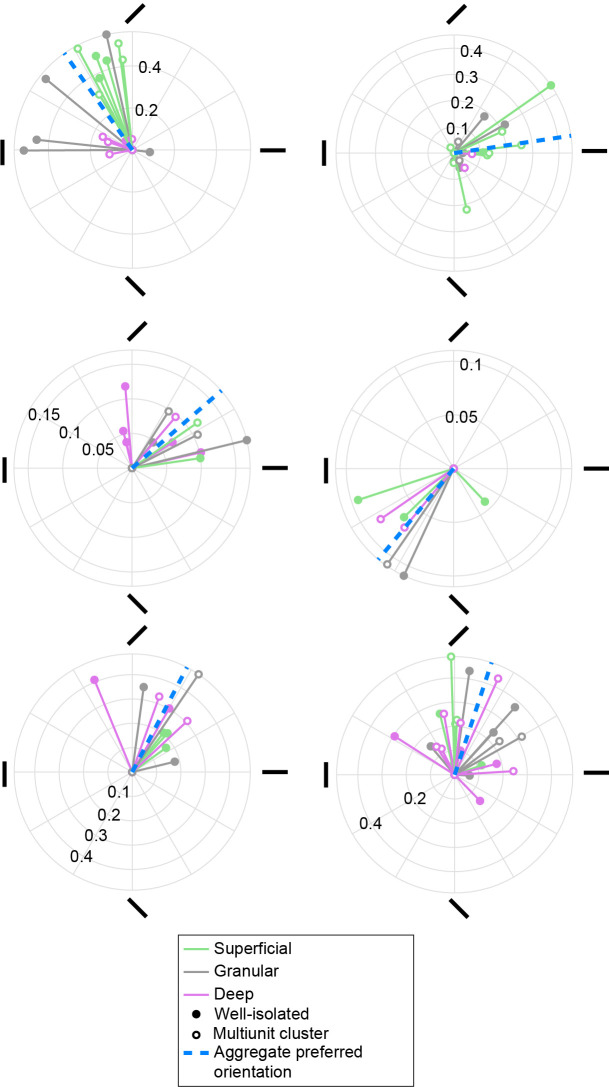
Figure 5. Columnar clusters of preferred orientation in V4.
Polar plots are shown for six penetrations with at least four orientation-selective units distributed across all three laminar compartments. Each solid vector corresponds to one unit and indicates the preferred orientation (direction) and the degree of orientation tuning (magnitude), quantified, respectively, as the direction and magnitude of the resultant vector of the responses to each orientation. Color indicates the laminar compartment. Open symbols indicate multiunits, closed symbols indicate well-isolated units. Blue dashed line indicates the preferred orientation across units in a penetration (aggregate preferred orientation). All six penetrations shown have a significant aggregate preferred orientation.

