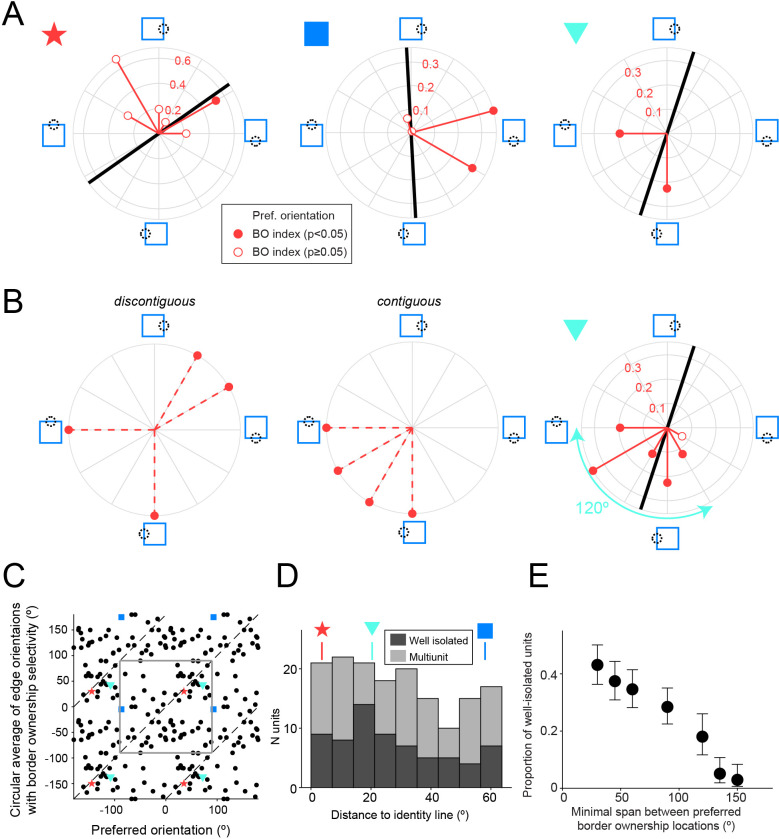
Figure 6. Border ownership selectivity often occurs far away from the preferred orientation.
(A) Polar plots for three example units that were tested for border ownership selectivity with edges of multiple orientations (orientations of red vectors indicate tested orientations). Polarity of red vector relative to origin indicates the preferred side of border ownership for each edge orientation, according to the stimulus cartoons surrounding the plot, and filled circles indicate cases with statistically significant border ownership selectivity (adjusted for multiple comparisons using Bonferroni correction). Magnitude of red vectors corresponds to |BOI|. Black line indicates preferred edge orientation. Colored symbols on the upper left side of each polar plot correspond to the symbols in C and D. See also Figure 6—figure supplement 1. (B) Left and middle: for units showing border ownership selectivity to orthogonal edges there are two possibilities for the intermediate edge orientations. Either the preferred sides of border ownership are spatially discontiguous with those for the orthogonal edges (left), or they are contiguous (middle). Right: polar plot for the same unit as in A (right polar plot), now including data for the orientations that were not shown in A. (C) Scatter plot comparing the preferred orientation for edges (abscissa) with the circular mean of edge orientations for which border ownership selectivity is significant (ordinate), for all units that were tested for border ownership for at least four orientations (n = 68 well-isolated units). Note that each data point is plotted four times, because both variables are periodic and two periods are shown for each. The gray square outlines an area corresponding to one period for both variables. Dashed lines indicate identical values. Colored symbols correspond to the units in A, B, and D. (D) Smallest orthogonal distance to the identity line for the units shown in C. The data are significantly biased toward zero (see Results). Distance values for the example units shown by colored symbols in A–C are indicated above the histogram. (E) Proportion of border ownership well-isolated units where the preferred sides of border ownership cover an angular span at least as wide as the value indicated along the abscissa (for all units tested with such spans). For example, the unit in B (right) has a span of preferred sides of border ownership of 120°. Note that the span between spatially contiguous preferred sides of border ownership is necessarily <180°. N units tested for each value of on the abscissa: ≥30°: 211; ≥45°: 211; ≥60°: 211; ≥90°: 211; ≥120°: 122; ≥135°: 118; ≥150°: 102.


