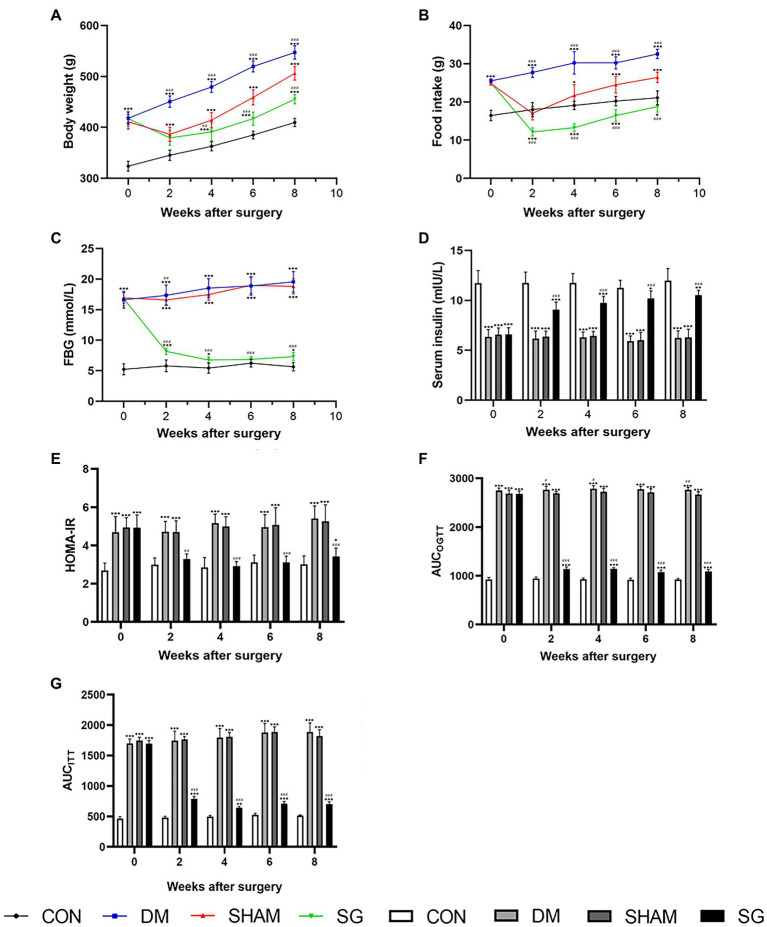
Figure 2.
The effect of SG on the metabolic parameters. (A) Body weight, (B) food intake, (C) FBG, (D) serum insulin, (E) HOMA-IR, (F) AUCOGTT, (G) AUCITT before and after operation. Data are expressed as means±SEM for n=10 per groups. *p<0.05 vs. CON group, **p<0.001 vs. CON group, ***p<0.0001 vs. CON group; #p<0.05 vs. SHAM group, ##p<0.001 vs. SHAM group, ###p<0.0001 vs. SHAM group. FBG, fasting blood glucose; HOMA-IR, homeostasis model assessment of insulin resistance; AUCOGTT, the area under the curve of the oral glucose tolerance test; AUCITT, the area under the curve of the insulin tolerance test; CON, control; DM, diabetes mellitus; SHAM, sham operation; SG, sleeve gastrectomy.

