Figure 5.
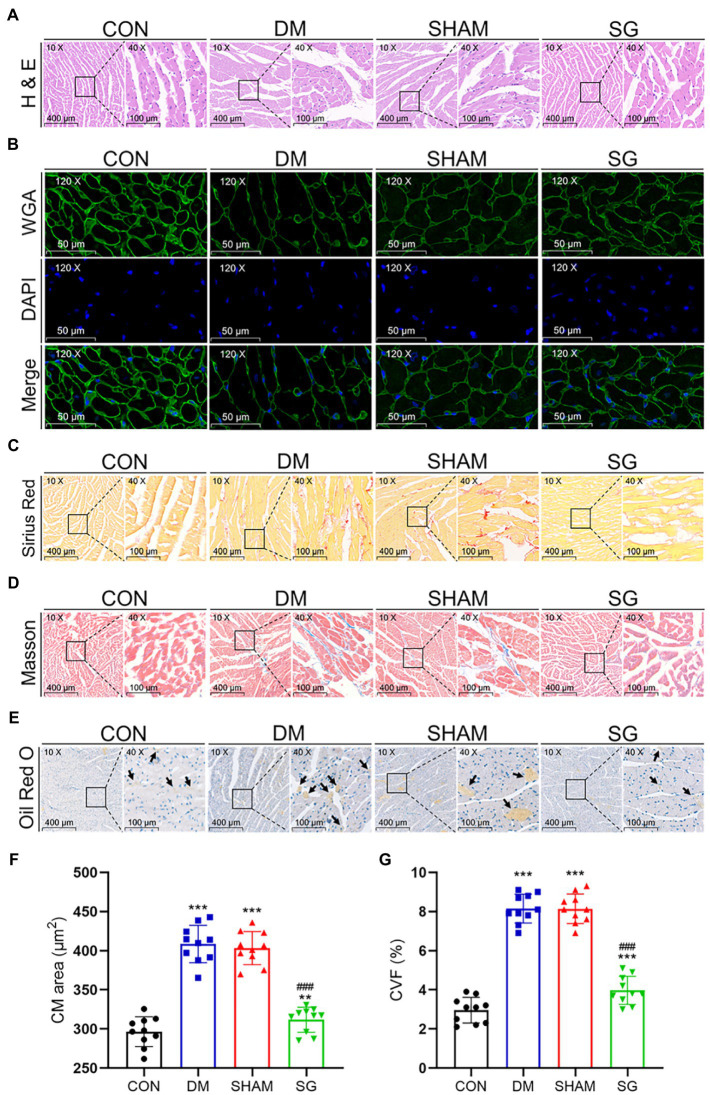
The reversal effect of SG on the heart morphometric and histological. The representative (A) H&E, (B) WGA, (C) Sirius Red, and (D) Masson stainings of heart tissue. (E) The Oil Red O staining of heart tissue, and arrows show lipid droplets (magnification 10×, scale bars represent 400μm; magnification 40×, scale bars represent 100μm; magnification 120×, scale bars represent 50μm). The (F) CM area and (G) CVF were calculated and analyzed. Data are expressed as means±SEM for n=10 per groups. *p<0.05 vs. CON group, **p<0.001 vs. CON group, ***p<0.0001 vs. CON group; #p<0.05 vs. SHAM group, ##p<0.001 vs. SHAM group, ###p<0.0001 vs. SHAM group. H&E, hematoxylin and eosin; WGA, wheat germ agglutinin; CM, cardiac myocyte; CVF, collagen volume fraction; CON, control; DM, diabetes mellitus; SHAM, sham operation; SG, sleeve gastrectomy.

