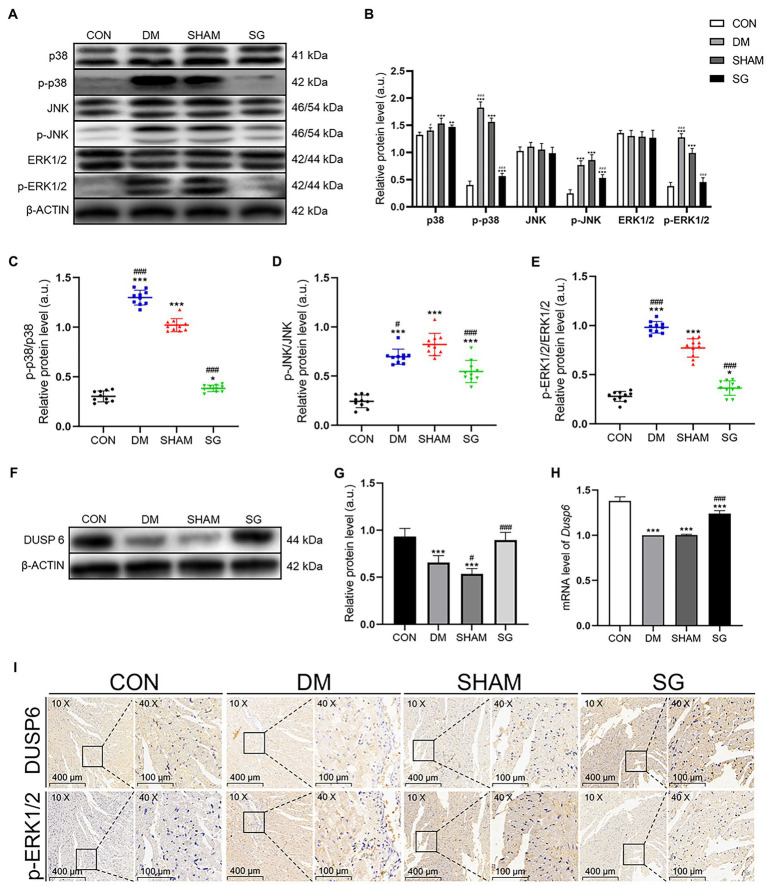
Figure 6.
The effect of SG on MAPK signaling pathway and the expression of DUSP6. (A) The representative bands of p38, p-p38, JNK, p-JNK, ERK1/2, and p-ERK1/2, and (B) relative protein level of p38, p-p38, JNK, p-JNK, ERK1/2, and p-ERK1/2 were quantitatively analyzed. (C–E) The expression ratio of p-p38 over total p38, p-JNK over total JNK, and p-ERK1/2 over total ERK1/2, respectively. (F) The representative bands of DUSP6 and (G) relative protein level of DUSP6 were quantitatively analyzed. (H) Cardiac mRNA level of Dusp6 was measured. (I) The representative immunohistochemical staining of DUSP6 and p-ERK1/2 (magnification 10×, scale bars represent 400μm; magnification 40×, scale bars represent 100μm). Brown staining is considered positive. Data are expressed as means±SEM for n=10 per groups. *p<0.05 vs. CON group, **p<0.001 vs. CON group, ***p<0.0001 vs. CON group; #p<0.05 vs. SHAM group, ##p<0.001 vs. SHAM group, ###p<0.0001 vs. SHAM group. CON, control; DM, diabetes mellitus; SHAM, sham operation; SG, sleeve gastrectomy.

