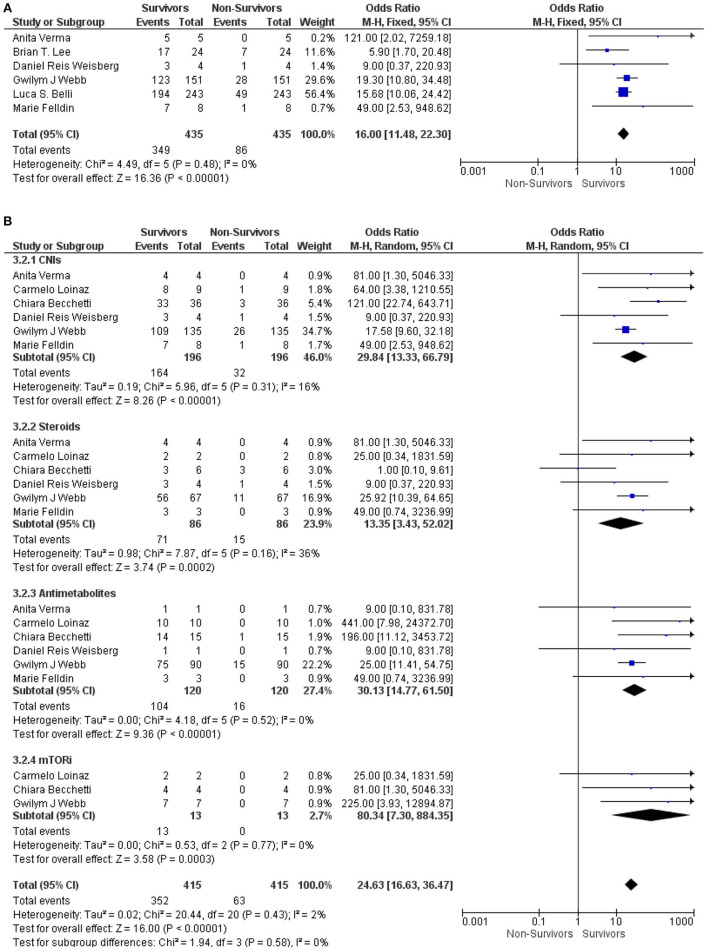
Figure 3.
(A) Forest plots for an association between the survivors and non-survivors LT recipients with COVID-19 for the overall ISs. (B) Forest plots for an association between the survivors and non-survivors LT recipients with COVID-19 with subgroup analysis for the CNIs, steroids, antimetabolites, and mTORis therapy.

