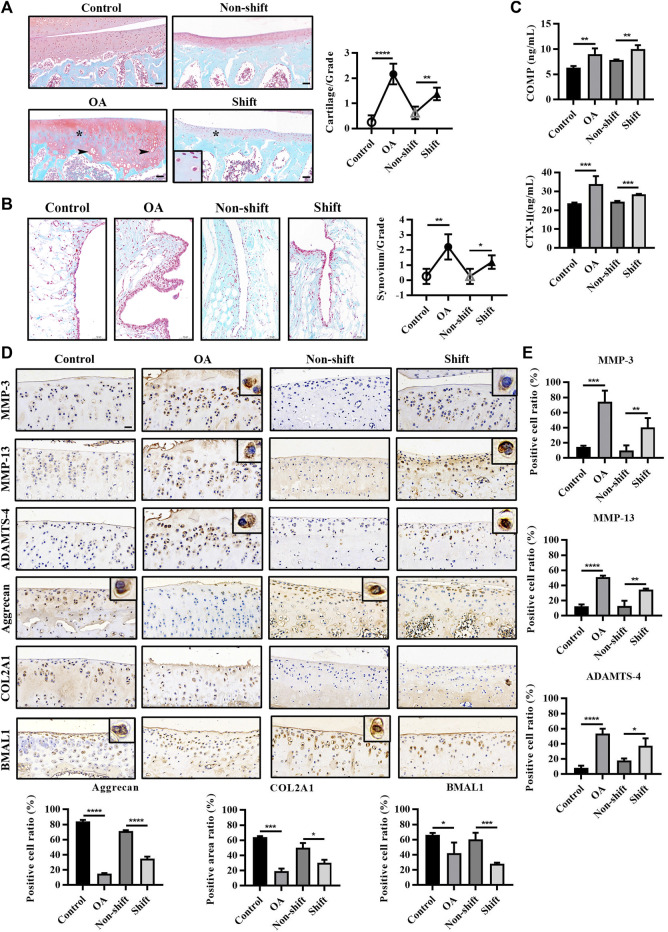
FIGURE 2.
Pathological changes and immunological detection of knee cartilage in each group. (A) Safranine O and fast green staining of rat tibia cartilage and OARSI cartilage score. Arrows, vacuolar and hypertrophic chondrocytes; asterisk, absence of cationic staining. Magnification (Mag), 200×. Scale bar, 50 μm. Results are expressed as mean ± SD; n = 4–6. (B) Safranine O and fast green staining of rat knee synovium. Mag, 200×. Scale bar, 50 μm. Results are expressed as mean ± SD; n = 3–6. (C) Levels of COMP and CTX-Ⅱ in rat serum in each group. Results are expressed as mean ± SD; n = 4–6. (D,E) Immunohistochemical staining of MMP-3, MMP-13, ADAMTS-4, Aggrecan, COL2A1, and BMAL1 in chondrocytes. Mag, 200×. Scale bar, 50 μm. Results are expressed as mean ± SD; n = 4. *p < 0.05, **p < 0.01, ***p < 0.001, and ****p < 0.0001.

