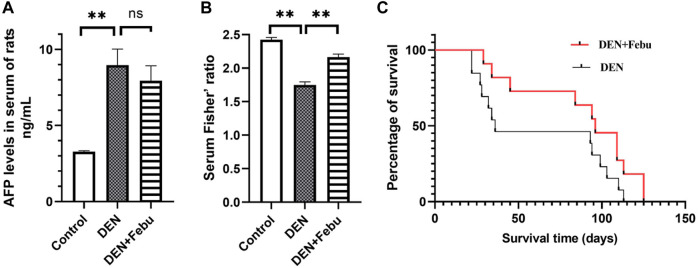
FIGURE 4.
Serum AFP level (A), Serum Fisher’ ratio in rats of control (n = 5), DEN (n = 14) and DEN + Feu (n = 14) group (B) and the survival curve (C, log-rank Mantel–Cox test, p = 0.0802) of HCC rats induced by DEN (n = 15) and those treated by Febuxostat (n = 15). **represent significant differences between groups (mean ± S.E.M, **p < 0.01).

