
Figure 10.
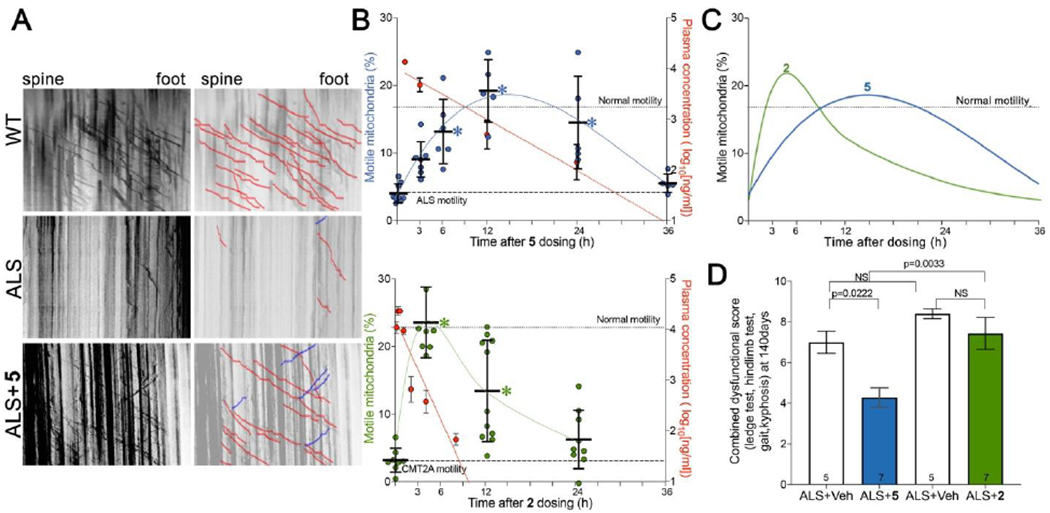
Pharmacodynamic and therapeutic effects of 5 vs 2 in murine ALS. A. Representative kymographs for wild-type (WT) and ALS SOD1G93A mice (ALS) 12 hours after oral administration of 5 or vehicle. B. Time-dependent pharmacokinetics/pharmacodynamics of 5 and 2 after single oral doses (60 mg/kg). (top) Blue values and left vertical axis show mitochondrial motility after 5 in ALS mouse sciatic nerve axons. (bottom) green values and left vertical axis show mitochondrial motility in CMT2A mouse sciatic nerve axons. Each point represents a single neuronal axon, from two or three mice per time point. Red values and right vertical axes of top graph show corresponding plasma 5 levels (n=5 per time point; means ± SD); plasma levels of 2 are from (17). Dotted line designated “Normal motility” is mean value for WT in panel A; dashed line designated “ALS motility” is mean value for untreated ALS in panel A. C. Comparative pharmacodynamics of 5 (blue) and 2 (green). D. Effects of 5 (blue) and 2 (green) on neuromuscular dysfunction score (ledge test, hindlimb test, gait, kyphosis; 25) in a proof-of-concept study of ALS mice. P values by ANOVA.