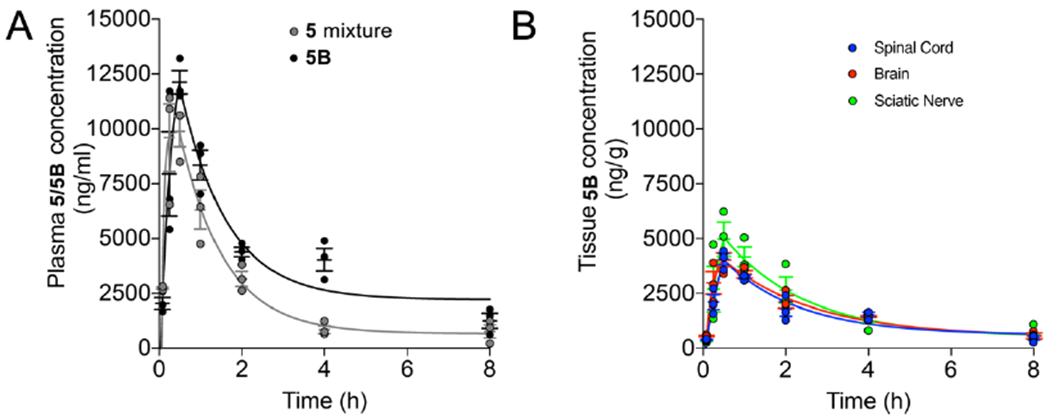
Figure 9. Plasma and tissue pharmacokinetics of 5B after oral administration to non-fasted mice.

A. Plasma pharmacokinetics of 5 isomeric mixture vs 5B in mice after a single oral dose of 50 mg/kg. B. Comparative neuronal tissue concentrations of 5B after a single oral dose of 50 mg/kg. Vertical axis values are the same in A and B. Data are means ± SEM, each dot represents one mouse. Calculated values are in the text.
