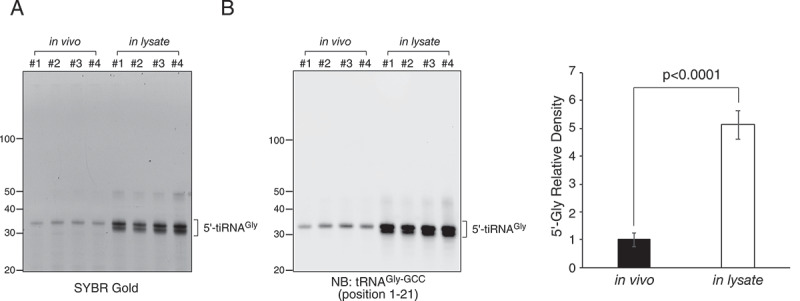
Figure 5.

Comparison of yield of 5ʹ-tiRNAGly-GCC pulldown between in vivo ANG treatment and in lysate ANG digestion. (a) SYBR Gold staining of purified RNA obtained by 5ʹ-tiRNAGly-GCC pulldown method. (b) Northern blotting of purified RNA against tRNAGly-GCC. Densitometry analysis of 5ʹ-tiRNAGly-GCC signals is also shown. Data are presented as the mean ± SD (n = 4)
