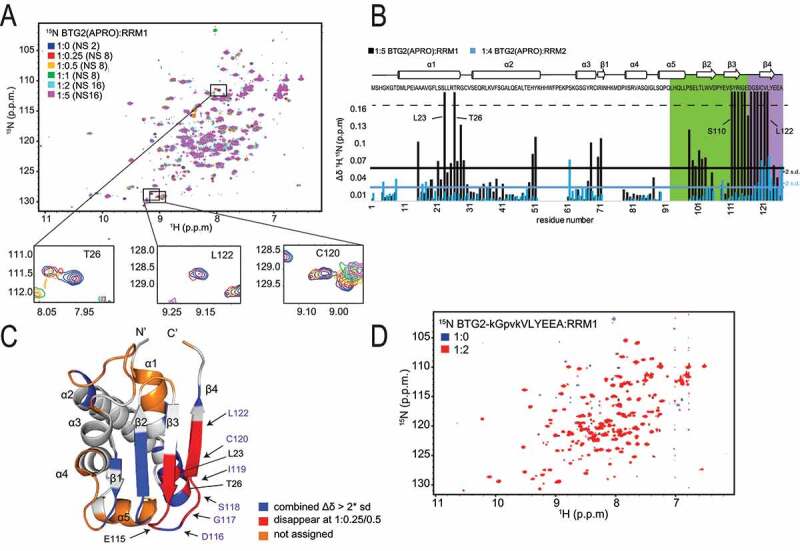
Figure 2.

NMR identification of the BTG2 residues involved in its interaction with PABPC1 RRM domains
A) Overlay of 1H-15N HSQC spectra of free BTG2(APRO) (blue) and in complex with increasing amounts of RRM1 (1:0.25 red; 1:0.5 orange; 1:1 green; 1:2 cyan; 1:5 magenta). Some key residues are indicated by a box and the close-up view shown below. The number of scans (NS) is indicated. B) Combined chemical-shift perturbations of BTG2(APRO) upon binding to RRM1 (black) or RRM2 (blue). The secondary structure and amino acid sequence are shown at the top, the boxB region is highlighted in green and boxC in violet. The black or blue horizontal line represents the two times the s.d. of all chemical shift differences. Peaks which disappear at 1:0.25 or 1:0.5 and did not return at higher ratios are indicated by bars with >0.16 ppm (dashed line). C) Cartoon representation of the structure of the human BTG2 APRO domain (pdb code 3DJU), corresponding to the protein sequence shown in B. Residues that show significant chemical shift changes (above the 2× s.d.) or disappear upon addition of RRM1 are shown in blue or red, respectively. Undetectable or unassignable backbone residues are coloured in orange. BoxC residues are indicated in violet. D) Overlay of 1H-15N HSQC spectra of BTG-kGpvkVLYEEA (blue) and BTG-kGpvkVLYEEA in complex with RRM1 (1:2, red).
