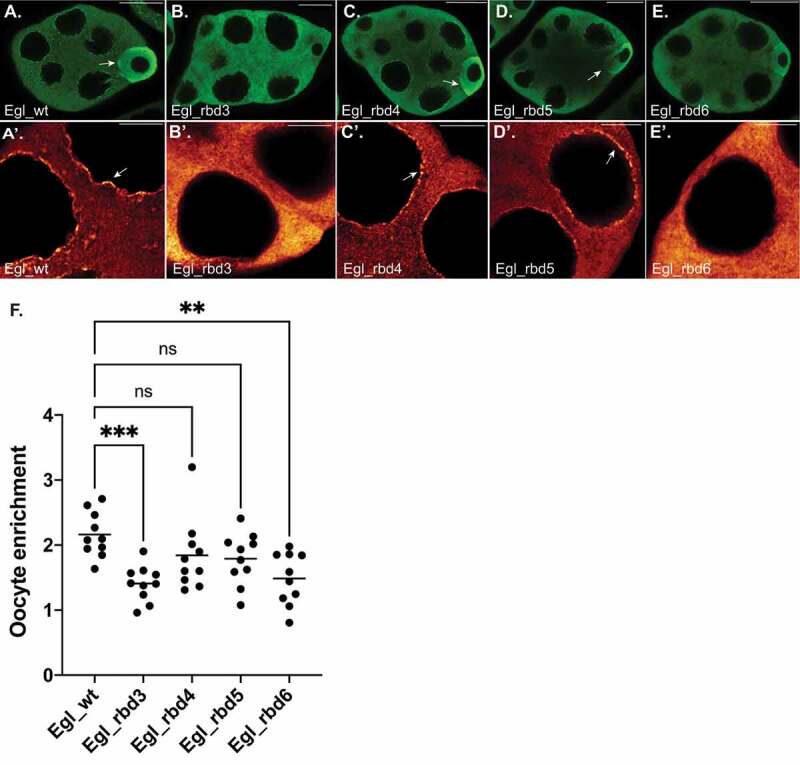
Figure 3.

Localization of Egl RNA binding mutants. (a–e) Ovaries were dissected from flies expressing GFP tagged versions of the indicated constructs. The ovaries were fixed and processed for immunofluorescence using a poly-clonal GFP antibody. The relative enrichment of the Egl to the oocyte (arrows) is shown in A-E and the localization to the nuage is shown in A’-E’ (arrows). (f) The enrichment of Egl within the oocyte relative to the entire egg chamber was quantified for the indicated genotypes. n = 10 egg chambers for each genotype. ***p ≤ 0.001, ** p ≤ 0.01, ns = not significant; a one-way ANOVA was used to calculate statistical significance. The scale bar in a-e is 20 microns; the scale bar in a’-e’ is 5 microns
