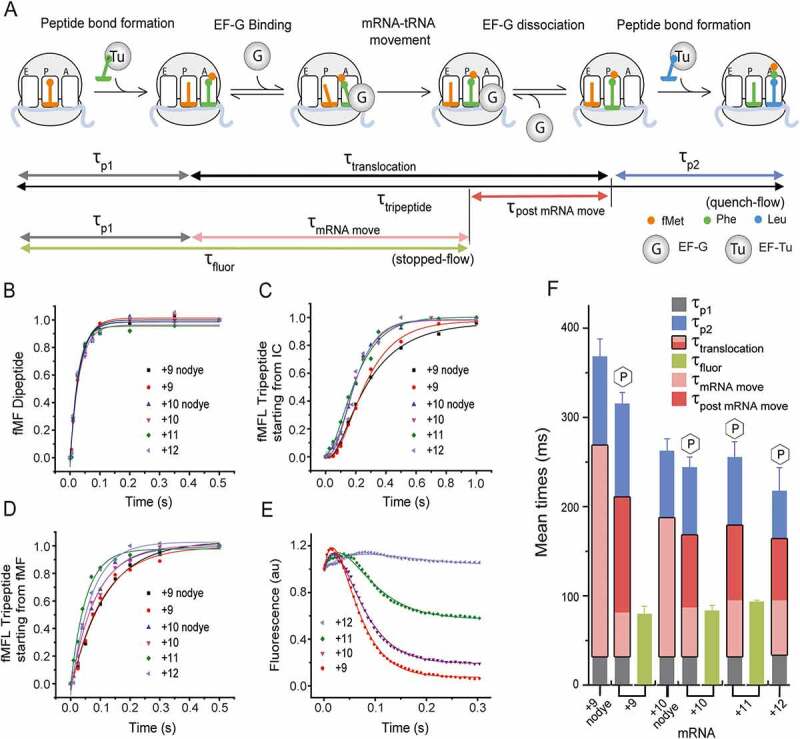
Figure 2.

Determination of the optimal length of the mRNA for fast rates and large fluorescence change
(A) Schematic representation of the peptide elongation cycle on the ribosome starting from the 70S IC. The process includes two peptide bond formation steps and one translocation step driven by EF-G. The di- and tripeptide formation experiments were conducted in quench-flow, where an elongation factor mix containing the respective TCs (5 µM) was rapidly mixed with the 70S IC (0.5 µM) containing mRNA and fMet-tRNAfMet in the P site. By fitting the kinetic data as described in the Materials and Methods, the mean times of the first peptide bond formation (τp1), second peptide bond formation (τp2) and tripeptide formation (τtripeptide) were determined. Both τp1 and τp2 include time starting from binding of TC and entire EF-Tu cycle. The mean time of a full translocation reaction (τtranslocation) was calculated as [τtripeptide– (τp1+ τp2)]. In parallel, the kinetics of translocation starting from the 70S IC was followed in stopped-flow, where the fluorescence change of the 3ʹ pyrene labelled mRNAs was monitored in real time. The mean time τfluor, indicated total time of all events starting from the 70S IC up to and including mRNA movement. The mean time for mRNA movement, τmRNA move, was determined by subtracting τp1 from τfluor. (B) Kinetics of the first peptide bond formation and (C) tripeptide formation in quench-flow starting from the 70S IC with the mRNAs as indicated.(D) Kinetics of the second peptide bond formation starting from the post-translocation complex with fMet-Phe-tRNAPhe in P site. (E) Kinetics of EF-G mediated mRNA movement during translocation in a stopped-flow starting from the 70S IC, monitored by the changes in pyrene fluorescence (343 nm excitation, 360 nm long-pass filter) with the mRNAs.(F) Bar diagram for direct comparison of the mRNAs for the mean times of different steps of elongation. The three stacked bars indicate τtripeptide obtained by quench-flow with clear demarcations for τp1 (grey), τtranslocation (pink/red) and τp2 (blue). For fluorescent mRNAs τtranslocation (pink/red) is divided into τmRNA mov (pink) and τpost mRNA move (red). For mRNAs without dye entire τtranslocation is in pink. The stopped-flow based mean times τfluor are presented by the green bars. The error bars represent standard deviation.
