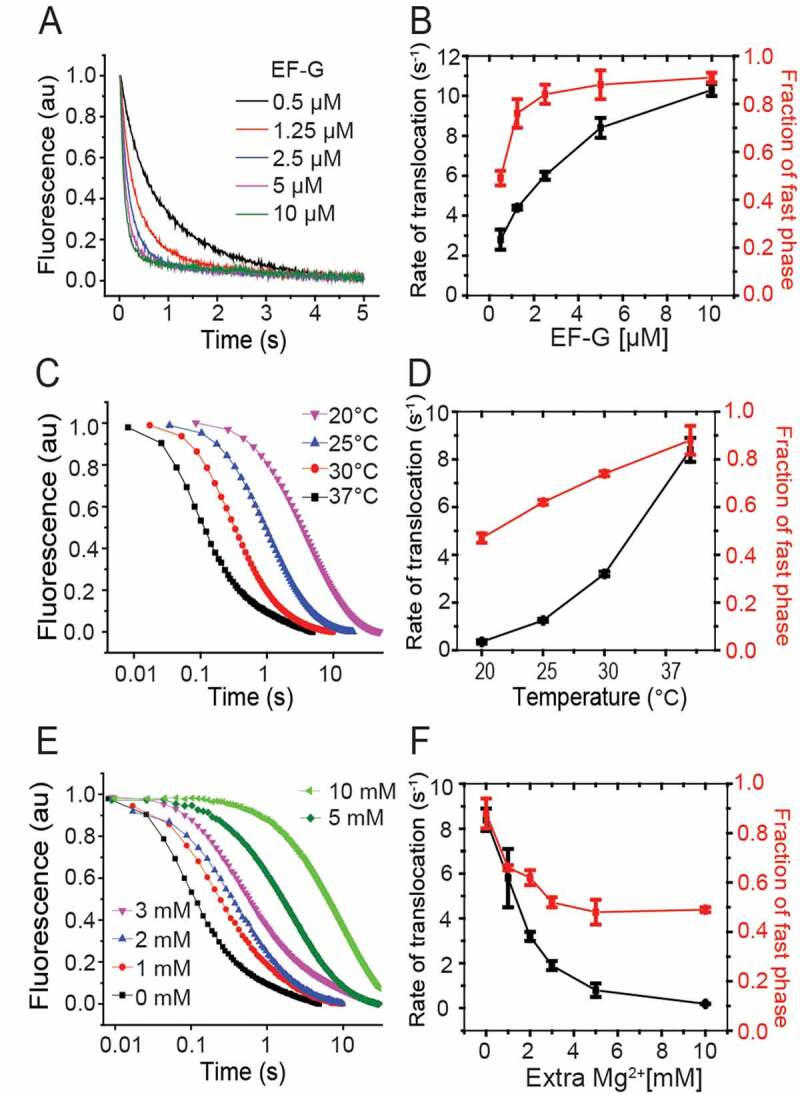
Figure 5.

Kinetics of NAc-Phe-tRNAPhe translocation with varying temperature and concentrations of EF-G and Mg2+
The kinetics of the mRNA movement during translocation was followed in stopped-flow, where EF-G was rapidly mixed to a NAc-Phe-tRNAPhe containing pre-T complex (0.5 µM). The left panels show the pyrene fluorescence traces monitored with 360 nm long-pass filter (343 nm excitation). The right panels present the rates and amplitudes of the fast phase of the fluorescence traces (Table 2). The plots represent measurements with varying concentration of EF-G (A, B), different temperature (C, D) and varying Mg2+ concentration (E, F). The rates and the fractional amplitude of the fast phase are summarized in Table 2.
