
Figure 7.
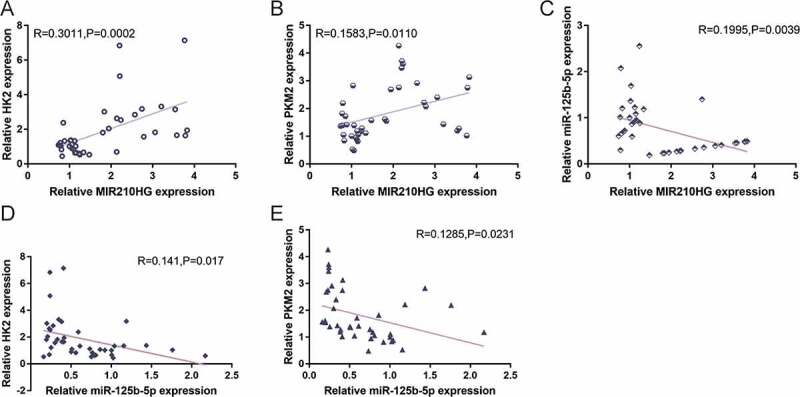
Correlation of MIR210HG/miR-125b-5p/HK2/PKM2 expression in tissue samples. The correlation between MIR210HG and HK2 expression (a), between MIR210HG and PKM2 expression (b), between MIR210HG and miR-125b-5p expression (c), between miR-125b-5p and HK2 expression (d), and between miR-125b-5p and PKM2 expression (e) was analysed using Pearson’s correlation analysis