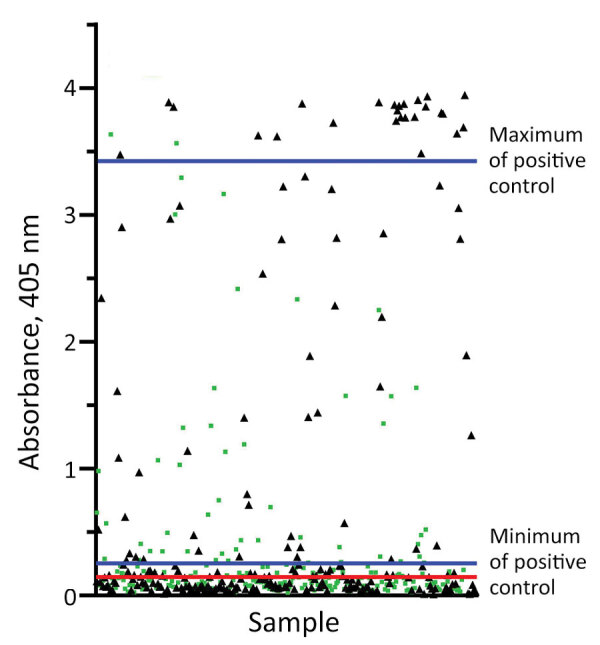
Figure 2.

Sample absorbance values measured by ELISA at 405 nm for 478 feral swine serum samples collected from defined endemic and nonendemic regions of Texas, USA. The red cutoff line represents the calculated assay cutoff between seropositive and seronegative animals (e.g., +3 SD above the mean of the negative control), equal to 0.15 absorbance units. Blue lines delineate the absorbance unit range of the positive assay control. Black triangles represent samples taken in endemic counties; green boxes represent samples taken in nonendemic counties.
