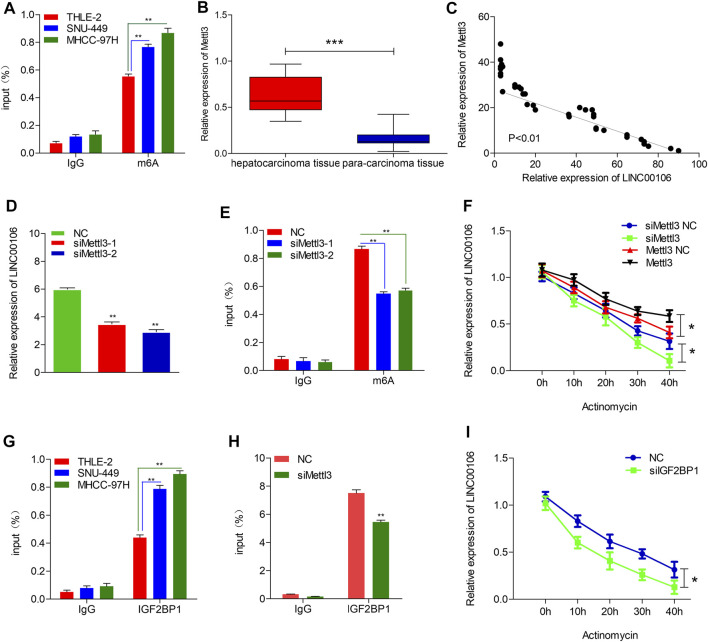
FIGURE 7.
Mettl3-induced m6A modification is involved in the upregulation of LINC00106. (A), RIP-qPCR showing the stronger enrichment of m6A in SNU-449 and MHCC-97H cells than that in THLE-2 cell. (B), Mettl3 expression was assessed in the HCC tissues and adjacent normal liver tissues. (C), LINC00106 expression was positively correlated with Mettl3 expression in an analysis of HCC tissues. (D), qRT-PCR of LINC00106 after Mettl3 inhibition in SNU-449 cells. (E), RIP-qPCR showing the enrichment of m6A in SNU-449 after Mettl3 depletion. (F), The expression of LINC00106 after treatment with 2.5 μM actinomycin D for indicated times, with depletion or overexpression of Mettl3 in SNU-449 cells. (G), RIP-qPCR showing the stronger enrichment of IGF2BP1 in SNU-449 and MHCC-97H cells than that in THLE-2 cell. (H), RIP-qPCR showing the enrichment of IGF2BP1 in SNU-449 with Mettl3 knockdown. (I), The expression of LINC00106 after treatment with 2.5 μM actinomycin D for indicated times, with IGF2BP1 knockdown in SNU-449 cells (*p < 0.05, **p < 0.01).

