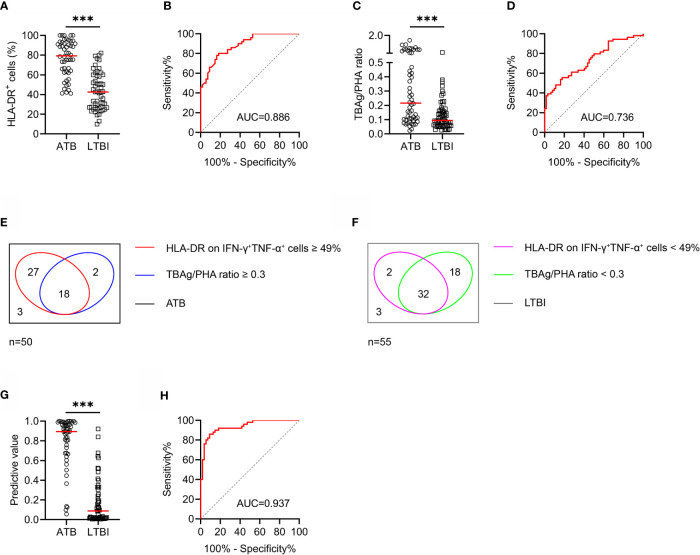
Figure 2.
The performance of various indicators in distinguishing ATB patients from LTBI individuals in Qiaokou cohort. (A) Scatter dot plots showing the results of the expression of HLA-DR on IFN-γ+TNF-α+ cells in ATB patients and LTBI individuals. Horizontal lines indicate the medians. ***P < 0.001 (Mann-Whitney U test). (B) ROC curve analysis showing the performance of HLA-DR on IFN-γ+TNF-α+ cells in discriminating ATB patients from LTBI individuals. (C) Scatter dot plots showing the results of TBAg/PHA ratio in ATB patients and LTBI individuals. Horizontal lines indicate the medians. ***P < 0.001 (Mann-Whitney U test). (D) ROC curve analysis showing the performance of TBAg/PHA ratio in discriminating ATB patients from LTBI individuals. (E) Venn diagrams showing the overlap of HLA-DR on IFN-γ+TNF-α+ cells and TBAg/PHA ratio in ATB patients. (F) Venn diagrams showing the overlap of HLA-DR on IFN-γ+TNF-α+ cells and TBAg/PHA ratio in LTBI individuals. (G) Scatter plots showing the predictive value of diagnostic model in ATB patients and LTBI individuals. Horizontal lines indicate the medians. ***P < 0.001 (Mann-Whitney U test). (H) ROC curve analysis showing the performance of diagnostic model based on the combination of HLA-DR on MTB-specific cells and TBAg/PHA ratio in discriminating ATB patients from LTBI individuals. MTB, Mycobacterium tuberculosis; ATB, active tuberculosis; LTBI, latent tuberculosis infection; TBAg, tuberculosis antigens; PHA, phytohemagglutinin; AUC, area under the curve.

