
Figure 5.
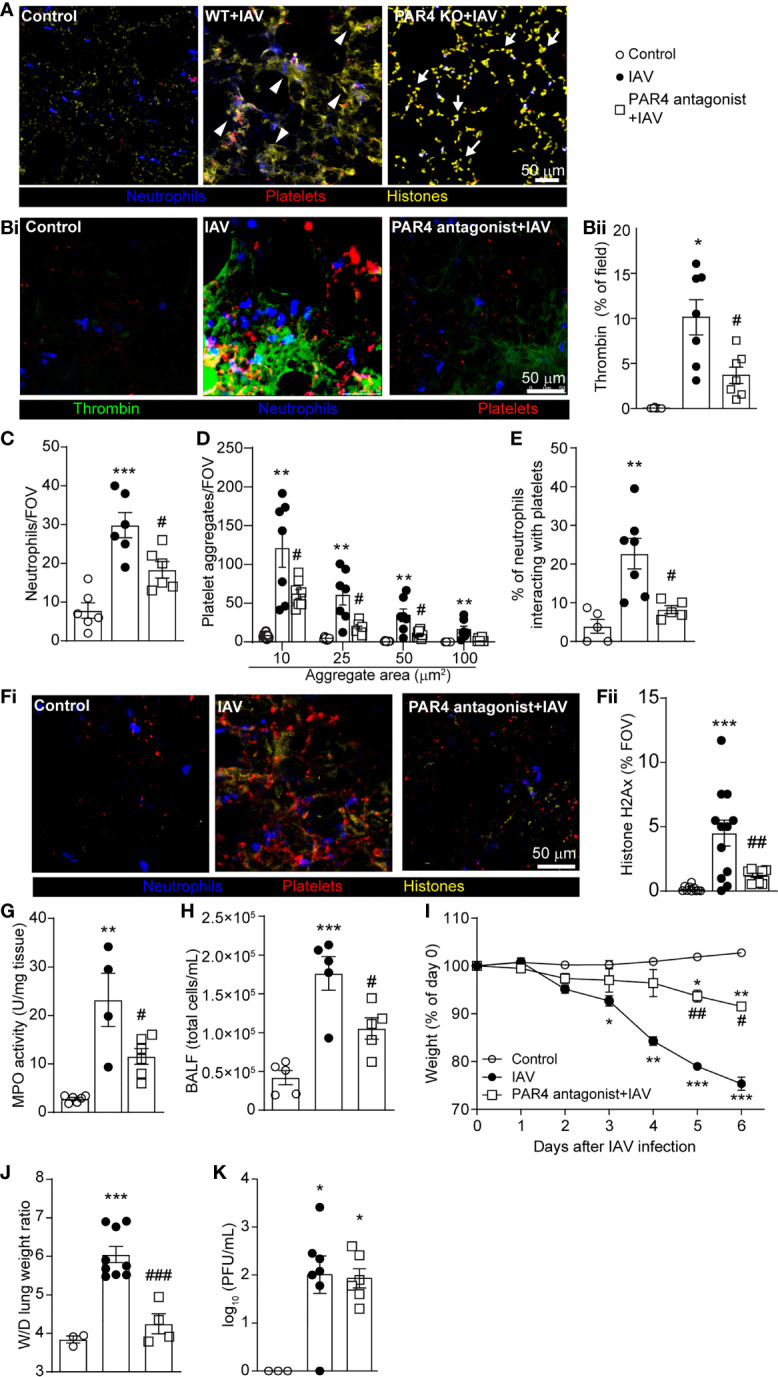
PAR4 Drives IAV-Induced Inflammation and Subsequent Tissue Damage. (A) Representative immunostaining of WT lung tissue uninfected control and WT and PAR4 KO (PAR4-/-) mice 5d after IAV infection (neutrophils, blue; histone, yellow; platelets, red). Arrowheads denote diffuse, intravascular histone staining (NETs), and full arrows indicate punctate, nuclear histone stain. (Bi) Representative IVM image of lungs of control (uninfected) and 5d post IAV infection of control and PAR4 antagonist (TcY-NH2)-pretreated mice demonstrating intravascular thrombin activity (neutrophils, blue; platelets, red; thrombin activity, green). (Bii) Quantification of thrombin activity measured as a % of the FOV labelled by the fluorescent substrate in uninfected control, IAV-infected control and PAR4 antagonist pretreated animals. Quantification of neutrophils (C), platelet aggregation (D), platelet-neutrophil interactions expressed as a % of neutrophils contacting platelets (E) in IAV-infected control and PAR4 inhibitor (TcY-NH2) pretreated mice. (Fi) Representative IVM image of lungs of control (uninfected) and 5d post IAV infection of control and PAR4 antagonist (TcY-NH2)-pretreated mice demonstrating histone staining (neutrophils, blue; histone, yellow; platelets, red). Quantification of extracellular histone (Fii), lung MPO activity (G), BALF cellularity (H), animal body mass (I), lung wet-to-dry tissue weight ratios (J), and viral loads (K) in IAV-infected control and PAR4 inhibitor (TcY-NH2) pretreated mice. Values represent the mean +/- SEM. n = 4-12 per group. *p < 0.05, **p < 0.01, ***p < 0.001 compared to the control group. #p < 0.05, ##p < 0.01, ###p < 0.001 compared to the IAV-infected group.