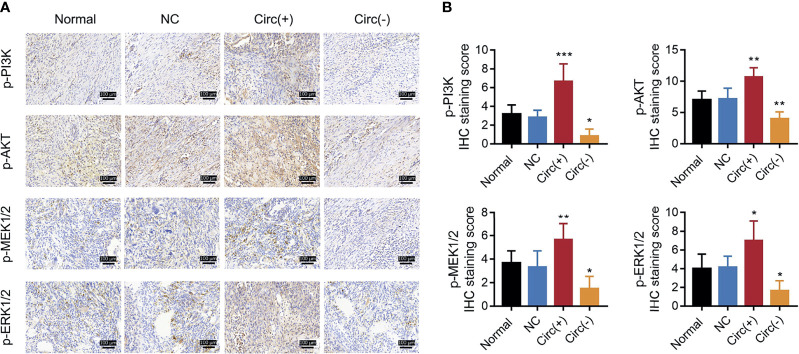
Figure 8.
PI3K/AKT and MEK/ERK pathways in NSCLC xenograft models. IHC staining examples (A) and IHC scores (B) of p-PI3K, p-AKT, p-MEK1/2, and p-ERK1/2 expression levels among the Normal, NC, Circ(+), and Circ(−) groups of NSCLC xenograft models. The IHC staining score was calculated based on intensity and density of stained cells. The intensity was scored as four grades: 0 (negative), 1 (weak), 2 (moderate), and 3 (strong); the density was scored as five grades: 0 (0%), 1 (1–25%), 2 (26–50%), 3 (51–75%), and 4 (76–100%). The final score of IHC assay was a product of the intensity score multiplying the density score. Each group had six mice. One-way ANOVA followed by Dunnett’s multiple comparisons test was used for comparison. *P value < 0.05, **P value < 0.01, ***P value < 0.001.

