Figure 7.

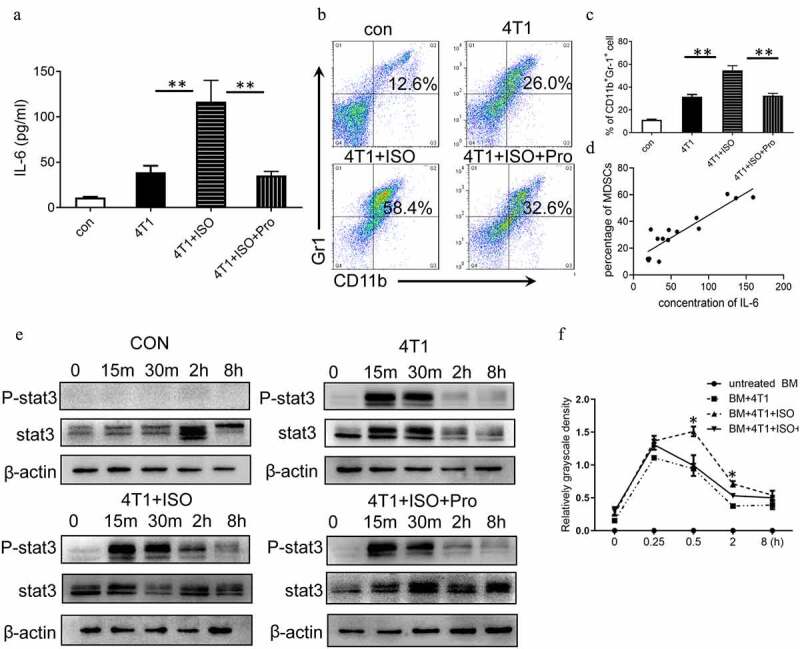
IL-6/STAT3 mediated the effects of NE on MDSC development. (a) 4T1 cells were treated with 10 μM ISO in the presence or absence of 10 ng/mL propranolol. The expression of IL-6 in the supernatants was analyzed by ELISA. (b, c) BM cells isolated from tumor-free BALB/c mice were cocultured with tumor cell supernatant to induce iMDSCs in vitro. The percentage of MDSCs was detected by flow cytometry. (b) Representative images from a single experiment. (c) Mean ± SEMs from three independent experiments. (d) The correlation analysis between the concentration of IL-6 and the proportion of MDSCs (R2 = 0.8207, P < .001). (e) BM cells isolated from tumor-free BALB/c mice were cocultured with different tumor cell supernatant. The expressions of STAT3 and phosphorylated STAT3 were detected at different time points by Western blots. (f) Quantification of phosphorylated STAT3 at different time points. The levels of phosphorylated STAT3 (p-STAT3) was compared using the density ratio of phosphorylated protein to total protein (p-STAT3/STAT3). Data were reported as mean ± SEM., *P < .05, **P < .01, Mann-Whitney test
