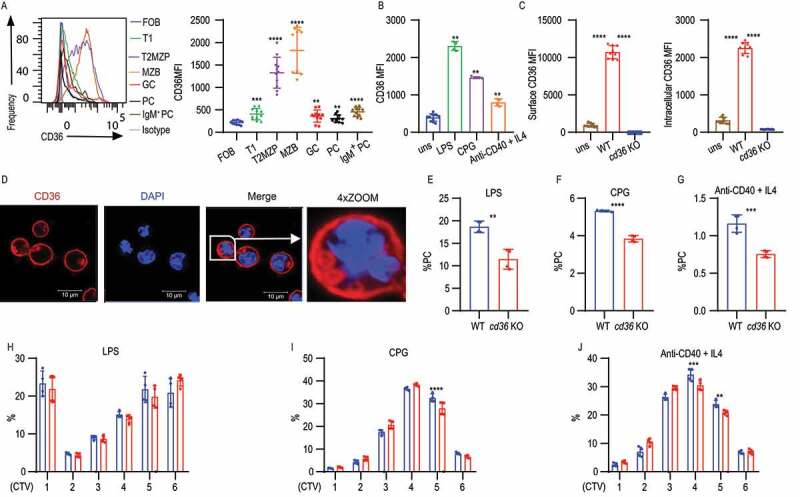
Figure 1.

CD36 deficiency leads to reduced B cell activation and changes in metabolic status in B cells. (A) Representative histograms (left) and quantification analysis of mean fluorescence intensity (MFI) (right) of CD36 staining in splenic B cells from C57BL/6 mice, including follicular B cells (FOB), transitional type 1 B cells (T1), T2MZP transitional type 2 marginal zone B cell progenitors (T2MZP), marginal zone B cells (MZB), germinal center B cells (GC) and plasma cells (PC). (B) MFI of CD36 staining in splenic B cells from WT and cd36 KO mice cultured with LPS, CPG, or anti-CD40 + IL4 for 3 d presented relative to unstimulated (uns). (C) MFI of surface (left) and intracellular (right) CD36 staining in splenic B cells from WT and cd36 KO mice after LPS stimulation. (D) Confocal microscopy analysis of CD36 staining in splenic B cells stimulated with LPS. Image size 35 µm × 35 µm. (E-G) The frequency of PCs derived from purified splenic B cells cultured for 3 d. (H-J) The bar charts showing the proliferation of splenic B cells from WT and cd36 KO mice stimulated with LPS, CPG, or anti-CD40 + IL4 measured by cell trace violet (CTV) dilution. Data are representative of three independent experiments. *P < 0.05, **P < 0.01 and ***P < 0.001 (Mann-Whitney test)
