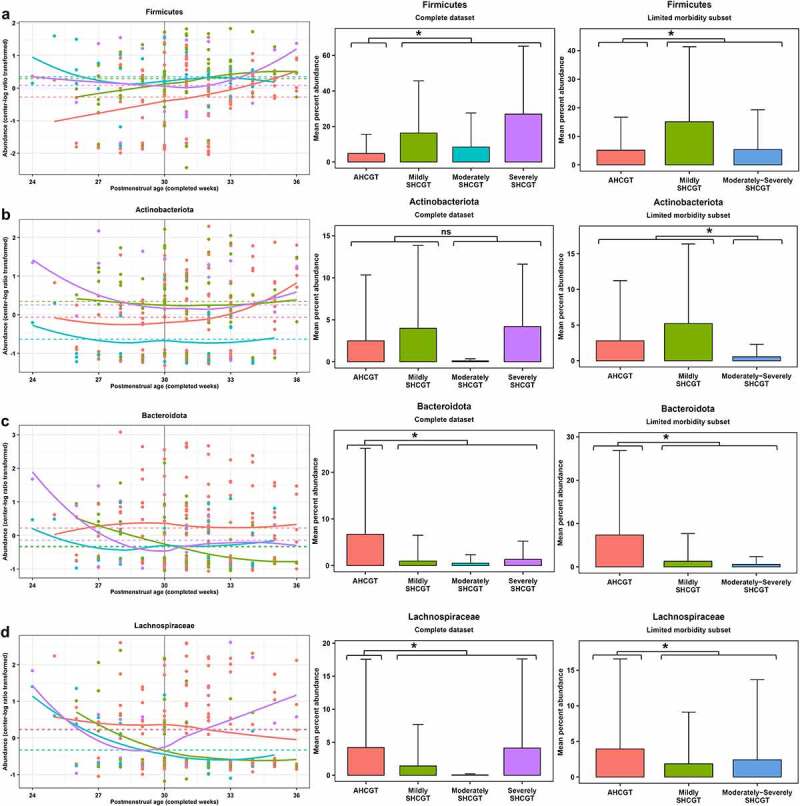
Figure 2.

Abundance of fecal microbial taxa that significantly differ by infant head circumference growth. Head circumference growth groups are defined in legend for Figure 1. Left panel displays center-log ratio transformed abundance pattern over completed weeks postmenstrual age for the complete dataset, with the solid line indicating the LOESS regression result for each study group and the dashed line indicating the least squares mean for each study group from linear mixed regression including postmenstrual age as an additional fixed effect and patient as a random effect. Middle and right panels display mean percent abundance with standard deviation bars for both the complete and limited morbidity datasets, respectively. *p< .05; FP<1%, ANOVA on multivariate regression. (a) Firmicutes. (b) Actinobacteriota. (c) Bacteroidota. (d) Lachnospiraceae.
