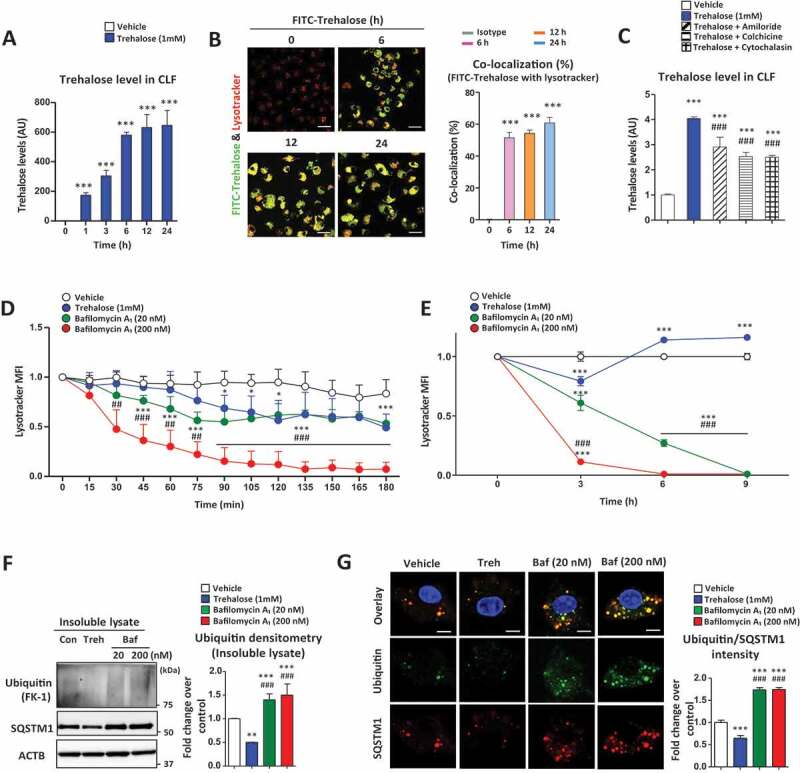
Figure 3.

Trehalose accumulates in lysosomes and affects lysosomal acidification. (A) Trehalose levels in the crude lysosomal fraction (CLF) of macrophages were measured by mass spectrometry after treatment with trehalose (1 mM) for the indicated times. AU = arbitrary units. (B) Macrophages treated with FITC-conjugated trehalose for indicated times, stained with the lysosomal marker LysoTracker and imaged by fluorescence microscopy for FITC (green) and LysoTracker Red (Red). Quantification of images is shown to the right graphed as colocalization percent of FITC-conjugated trehalose with LysoTracker Red (n ≥ 20 cells per group; scale bar: 20 μm). (C) Trehalose levels in the lysosomal fraction of macrophages were measured by mass spectrometry after treatment for 24 h with trehalose (1 mM) ± endocytosis inhibitors amiloride, colchicine, or cytochalasin B. (D) Live imaging of macrophages incubated with trehalose (1 mM) or bafilomycin A1 (20 nM or 200 nM) for 180 min after staining with LysoTracker Red to monitor lysosomal acidity. Quantification of LysoTracker Red mean intensity every 15 min is shown (n ≥ 30 cells per group). (E) Confocal imaging of macrophages incubated with trehalose (1 mM) or bafilomycin A1 (20 nM or 200 nM) for indicated times after staining with LysoTracker Red to monitor lysosomal acidity. Quantification of LysoTracker Red mean intensity every 3 h is shown (n ≥ 30 cells per group). (F) Detergent-insoluble lysates were prepared after incubations with trehalose (1 mM) or bafilomycin A1 (20 nM or 200 nM) for 12 h and subjected to Western blot analysis for polyubiquitinated proteins (FK-1 monoclonal antibody) and SQSTM1. ACTB/β-actin used as loading control. Densitometric quantification from (n = 3) independent experiments is shown. (G) Assessment of ubiquitination in macrophages by immunofluorescence microscopy after treatment with trehalose (1 mM) or bafilomycin A1 (20 nM or 200 nM) for 12 h. Quantification of images is shown to the right graphed as ubiquitin intensity fold-change over control (n ≥ 20 cells per group; scale bar: 10 μm). For all graphs are presented as Mean ± SEM. *P < 0.05, **P < 0.01 and ***P < 0.001, compare with vehicle; #P < 0.05, ##P < 0.01 and ###P < 0.001, compared with trehalose
