Figure 1.

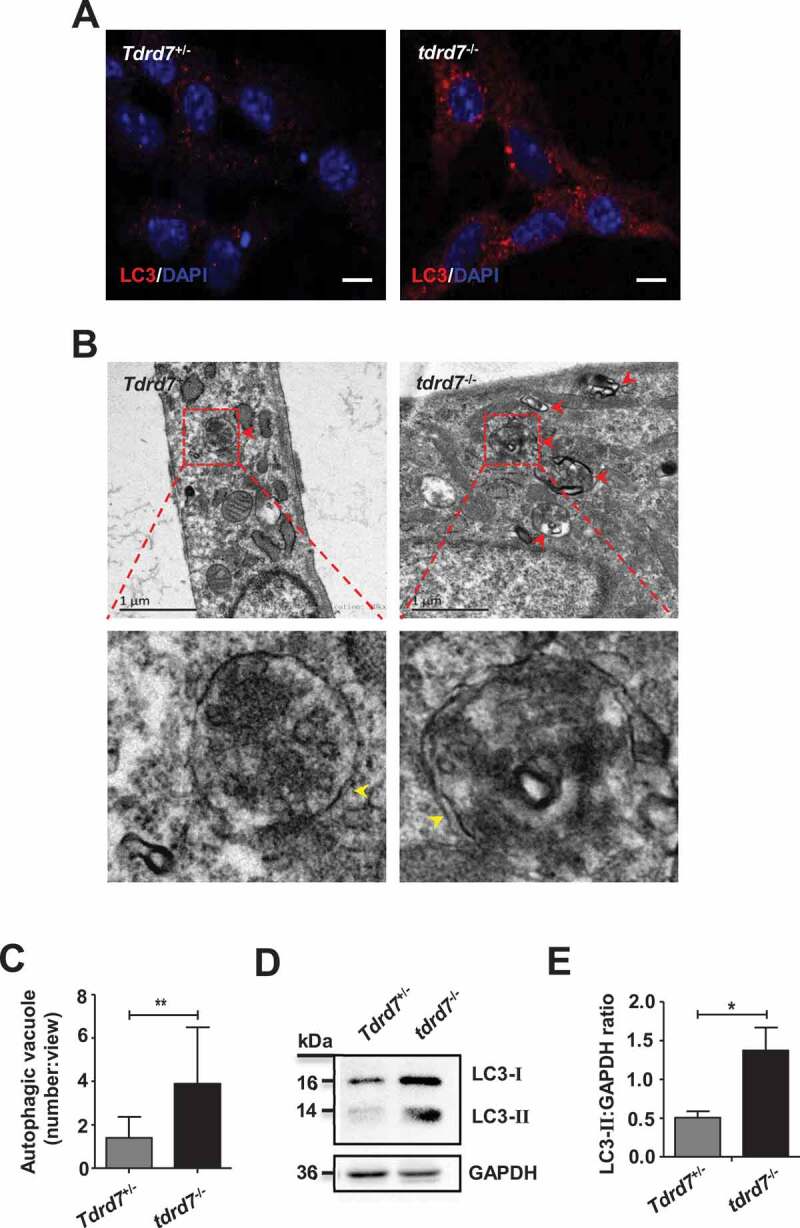
Evaluation of autophagosomes in Tdrd7+/− and tdrd7−/− MEFs. (A) Immunostaining of Tdrd7+/− and tdrd7−/− MEFs for the autophagic marker LC3 (red signal). (B) The accumulation of enlarged electron-light double-membraned structures (red arrows) in tdrd7-deficient MEFs. Some autophagosomes in tdrd7-deficient MEFs were observed as a part of enlarged multi-lamellar structures. Red dotted box: the magnified picture of autophagosomes of which the “double membranes” could be seen faintly (yellow arrows). Scale bar: 1 μm. (C) Quantification of the average number of autophagosomal structures in Tdrd7+/− and tdrd7−/− MEFs using TEM analysis. *P < 0.05. (D) Immunoblotting analysis of LC3 in both Tdrd7+/− and tdrd7−/− MEFs (left). (E) Quantification analysis revealed a significant accumulation of LC3-II (*P < 0.05), GAPDH served as a loading control. Data are representative of three independent assays
