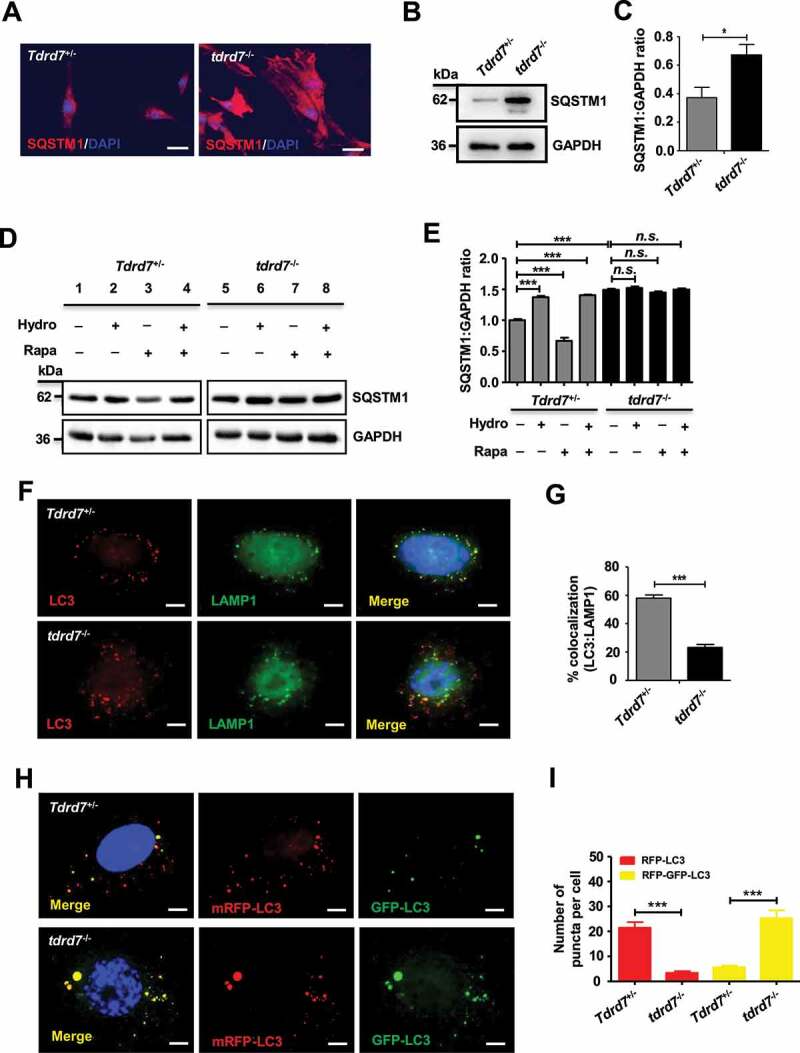
Figure 2.

Autophagosome maturation is blocked in tdrd7−/− MEFs. (A) Immunostaining of Tdrd7+/− and tdrd7−/− MEFs for SQSTM1 (red signal), an established indicator of disrupted autophagic flux. (B) Immunoblotting analysis of SQSTM1 in Tdrd7+/− and tdrd7−/− MEFs (left). (C) Quantification analysis revealed a significant accumulation of SQSTM1 (*P < 0.05); GAPDH served as a loading control. Data are representative of three independent assays. (D-E) Immunoblotting of Tdrd7+/− and tdrd7−/− MEF cell lysates for SQSTM1 following a 3-h treatment with DMSO as a vehicle control (lanes 1 and 5), 50 μM hydroxychloroquine (lanes 2 and 6) and 50 nM rapamycin (lanes 3 and 7) in complete medium, and combined treatment with 50 μM hydroxycloroquine and 50 nM rapamycin in complete medium (lanes 4 and 8); GAPDH served as a loading control. The gray level was measured using ImageJ (the signal in Tdrd7+/− MEFs following a 3-h DMSO treatment was set as 1 after normalization to GAPDH blotting). n.s.: not significant, ***P < 0.001. (F) Immunostaining for LC3 (red signal) and LAMP1 (green signal) in Tdrd7+/− and tdrd7−/− MEFs. Scale bar: 5 μm. (G) The colocalization of LC3 and LAMP1 is quantified, n = 20 cells of three independent experiments. **P < 0.01. (H-I) Autophagy flux in Tdrd7+/− and tdrd7−/− MEFs was assessed through an imageing-based co-localization analysis of mRFP-GFP-LC3. RFP positive and GFP negative indicates autolysosomes (red puncta). RFP positive and GFP positive indicates autophgosomes (yellow puncta). The nuclei were stained with 2-(4-amidinophenyl)-1 H-indole-6-carboxamidine (DAPI) (blue signals). Significance was established using the Student’ s t-test. ***P < 0.001. Scale bar: 5 μm
