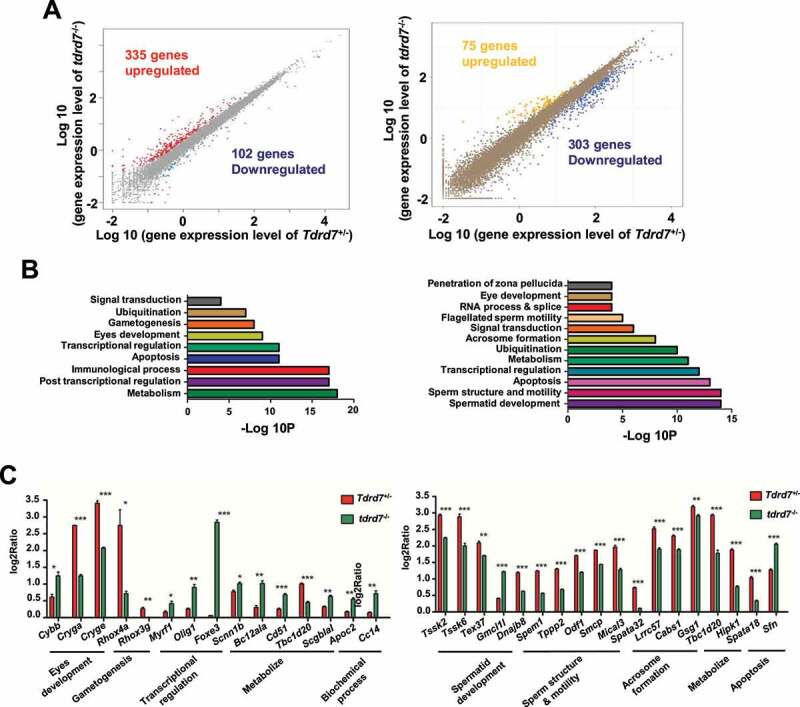
Figure 3.

Tdrd7 deficiency results in the abnormal expression of metabolism-related genes. (A) Significantly differentially expressed genes in the eyes (left) and testes (right). The red and blue colors indicate the upregulated and downregulated genes, respectively. (B-C) Gene Ontology term analysis of the significantly differentially expressed genes in the eyes (left) and testes (right). (D-E) Some genes involved in biological processes of the eyes (left) and testes (right) were randomly selected for qRT-PCR verification. Significance was established using the Student’ t test. *P < 0.05; **P < 0.01, ***P < 0.001
