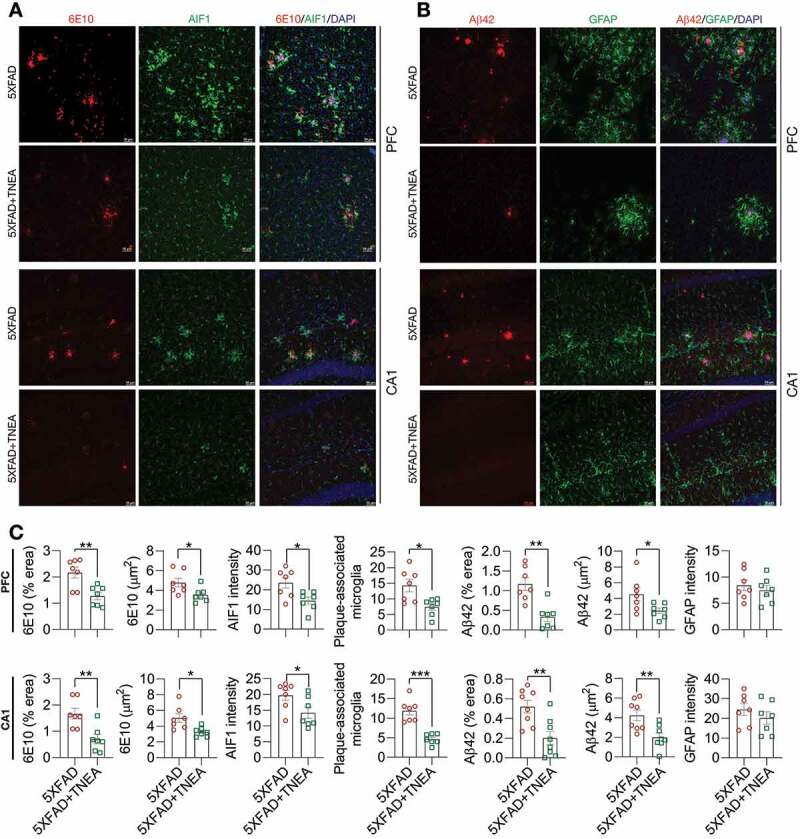
Figure 3.

TNEA treatment reduced Aβ load and inhibits microglia activation in 5XFAD mice brains. (A) Representative immunohistochemistry images of AIF1/IBA1 (green), Aβ (6E10, red) and DAPI (blue) in prefrontal cortex (PFC) and hippocampal CA1 of 7-month-old 5XFAD mice after EA treatment (scale bar: 50 μm). (B) Representative immunohistochemistry images of GFAP (green), Aβ1-42 (red) and DAPI (blue) in PFC and hippocampal CA1 of 7-month-old 5XFAD mice after EA (scale bar: 50 μm). (C) Aβ area, Aβ size, AIF1/IBA1 intensity, plaque associated microglia and GFAP intensity in PFC and CA1 were quantified as mean ± SEM (male, n = 7–8). *p < 0.05, **p < 0 .01 and ***p < 0.001 vs. 5XFAD group analyzed by Unpaired t test
