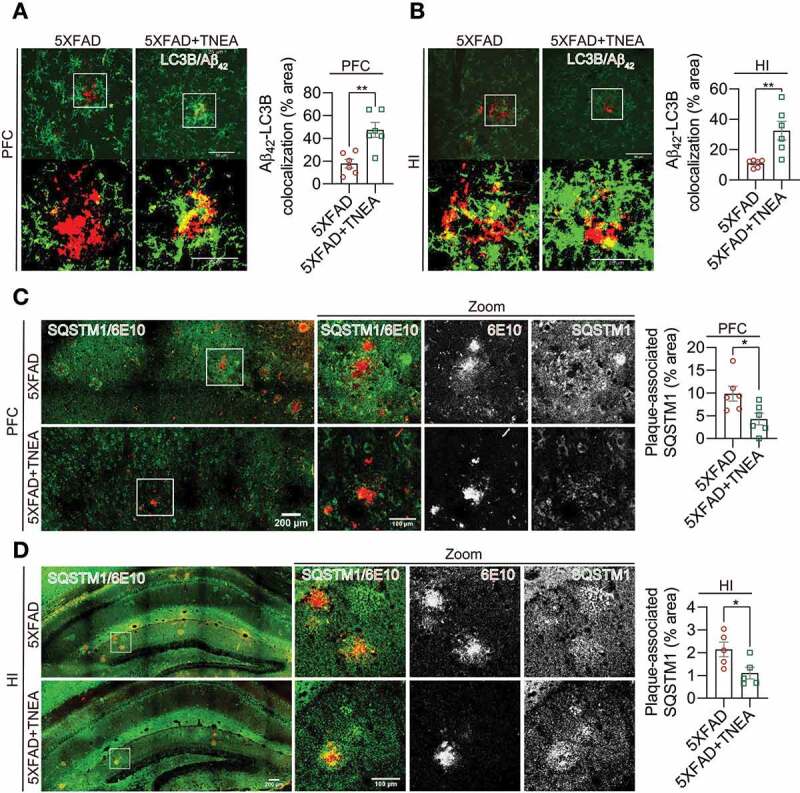
Figure 8.

TNEA treatment restored the defective recognition and degradation of autophagy substrates in 5XFAD mice brains. (A, B) Representative fluorescent images of LC3B (green) and Aβ42 (red) in prefrontal cortex (PFC) (A) and hippocampal (HI) CA1 (B) of mice from 5XFAD and 5XFAD+TNEA groups. Original magnification: 60×, scale bar: 50 μm. Corresponding zoom-in images (scale bar: 25 μm) were processed using ImageJ to demonstrate the colocalization. The area of LC3B and Aβ42 colocalization was quantified as mean ± SEM (male, n = 6) and analyzed by unpaired t test. **p < 0 .01 vs. 5XFAD group. (C, D) Representative fluorescence images of SQSTM1 (green) and APP/Aβ (6E10, red) in PFC (C) and CA1 (D) of mice from 5XFAD and 5XFAD+TNEA groups. Original magnification: 20×, scale bar: 200 μm. Corresponding zoom-in images (scale bar: 100 μm) were processed using ImageJ to demonstrate the colocalization. The area of plaque-associated SQSTM1 was quantified as mean ± SEM (male, n = 5 to 6) and analyzed by unpaired t test. *p < 0 .05 vs. 5XFAD group
