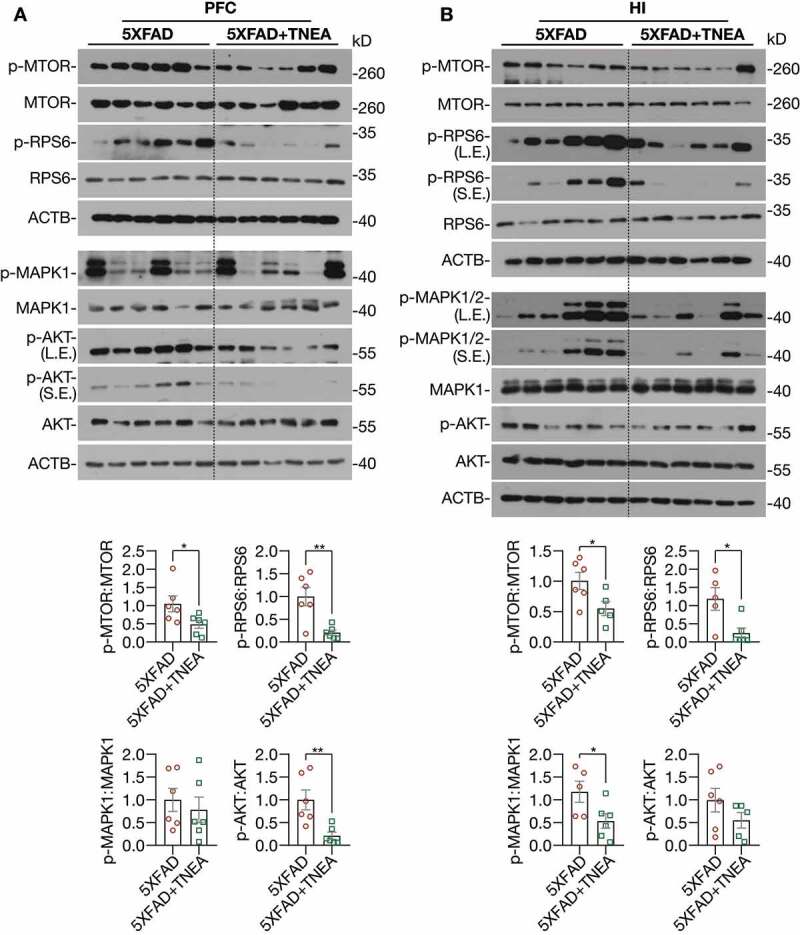
Figure 11.

TNEA treatment inhibited MTORC1, AKT and MAPK1 in 5XFAD mice brains. Representative western blots and quantification showed the levels of phosphorylated (p-) and total MTOR, RPS6, AKT and MAPK1 in the prefrontal cortex (PFC) (A) and hippocampus (HI) (B) of mice brains. Data were quantified as mean ± SEM (male, n = 6). *p < 0.05 and **p < 0.01 vs. 5XFAD group respectively analyzed by unpaired t test
