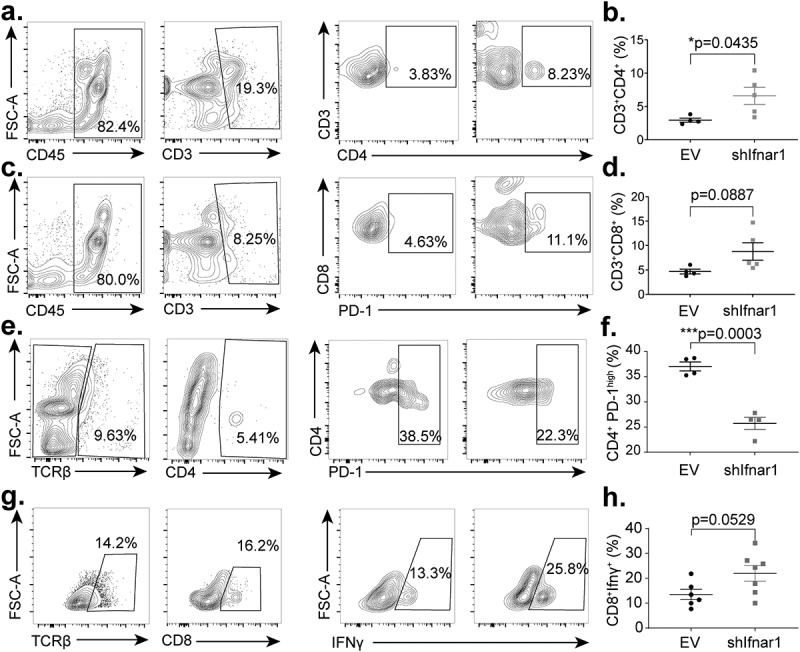
Figure 4.

Cancer-cell-specific IFN-I receptor signaling potentiates effector T-cell exhaustion in the tumor microenvironment. Tumors were harvested 36 days following tumor implantation, and lymphocytes were isolated using a Ficoll-Paque gradient. (a-b) The proportion of CD3+CD4+TILs were assessed by flow cytometry. Gating strategy was as follows: Lymphocytes, single cells, Zombie Aqua negative (viability), CD45-positive, CD3-positive (n = 4 in the control group, n = 5 in the shIfnar1 group). (c-d) The proportion of CD3+CD8+ T-cells in TILs or spleens were assessed by flow cytometry. Gating strategy was as follows: Lymphocytes, single cells, Zombie Aqua negative (viability), CD45-positive, CD3-positive (n = 4 in the control group, n = 5 in the shIfnar1 group). (e-f) The proportion of CD4+PD1highT-cells in TILs were quantitated by flow cytometry. Gating strategy was as follows: Lymphocytes, single cells, Zombie Aqua negative (viability), CD45-positive, TCRβ-positive, CD4-positive (n = 4 in the control group, n = 5 in the shIfnar1 group). (g-h) TILs were stimulated with PMA (1.0 mg/ml), Ionomycin(10.0 mg/ml), and Monensin (1×) for 4 hours and permeabilized for intracellular IFN-γ staining. The proportion of CD8+IFN-γ+ T-cells in TILs was shown. The gating strategy was as follows: Lymphocytes, single cells, Zombie Aqua negative (viability), CD45-positive, TCRβ-positive, CD8-positive (n = 6 in the control group, n = 7 in the shIfnar1 group). The tumor growth in vivo is representative of three repeats. All comparisons between the two groups were made using a two-tailed unpaired t test (*P< .05, *** P.< .001)
