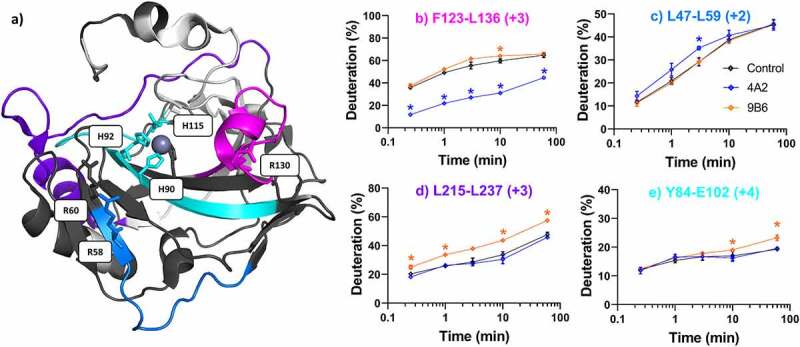
Figure 4.

Differential HDX-MS of potential inhibitors m4A2 and m9B6 bound to ΔPG- CAIXCys38Ser (PDB 3IAI). Regions demonstrating significant stabilization (3x SD, p = .01) across overlapping peptides at any single time point are color coded for clarity. Regions with no significant change are shown in dark gray, while white corresponds to missing coverage. Key residues are shown as stick models (R58, R60, R130, H90, H92, H115), and zinc is shown as a gray sphere. Kinetics plots corresponding to select peptides within structurally significant region are shown with arrows indicating associated structural features. Unbound hCAIX control is shown in black, m4A2 in blue, and m9B6 in Orange, and significant changes in deuteration are marked by asterisks. Data collected in triplicate
