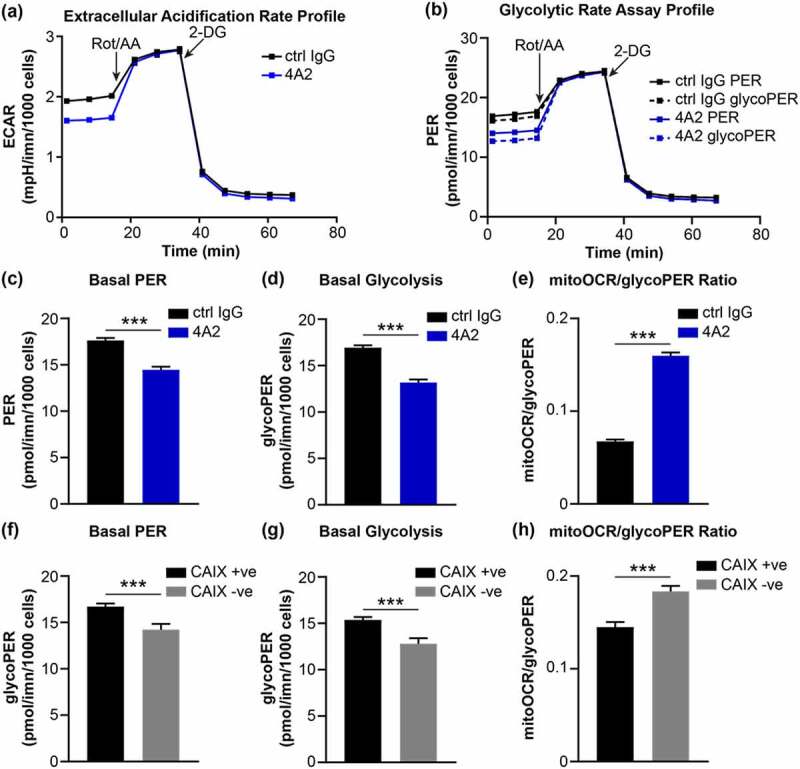
Figure 7.

(a) Extracellular acidification profile of MDA-MB-231 human breast cancer cells constitutively expressing CAIX that were cultured with 10 μg/ml of 4A2 and subjected to a Glycolytic Rate Assay. Cells cultured with 10 μg/ml of 4A2 were used as a control. Rot/AA, rotenone with antimycin A; 2-DG, 2-deoxy-D-glucose. (b) Profile of proton efflux rate (PER) and glycolytic PER (glycoPER) of cells cultured as described in panel a. (c-e) Quantification of (c) basal proton efflux rate (PER), (d) basal glycolysis and (e) ratio of mitochondrial oxygen consumption rate to glycolytic proton efflux rate of cells cultured as described in panel a. (f-h) Quantification of (f) basal proton efflux rate (PER), (g) basal glycolysis and (h) ratio of mitochondrial oxygen consumption rate to glycolytic proton efflux rate of MDA-MB-231 human breast cancer cells constitutively expressing CAIX (CAIX +ve) or depleted of CAIX expression (CAIX – ve) and assessed using the Glycolytic Rate Assay. Data show the mean ± SEM of technical replicates (n = 5–6/group) ***P < .001
